. 2014 Jan 1:84:534-45.
doi: 10.1016/j.neuroimage.2013.08.069. Epub 2013 Sep 7.

Visualization of intra-thalamic nuclei with optimized white-matter-nulled MPRAGE at 7T

Affiliations

Visualization of intra-thalamic nuclei with optimized white-matter-nulled MPRAGE at 7T

Thomas Tourdias et al. Neuroimage. .

Abstract

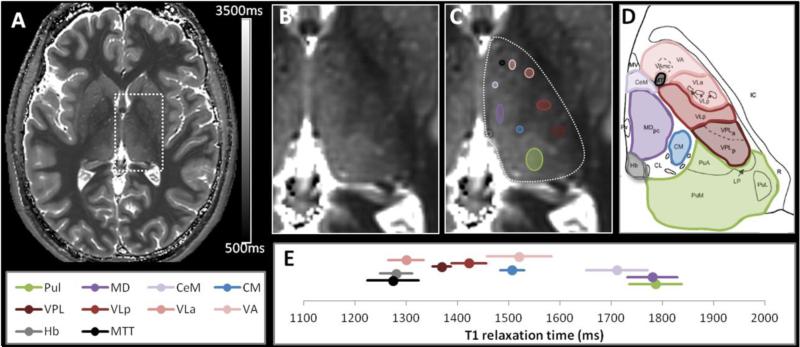
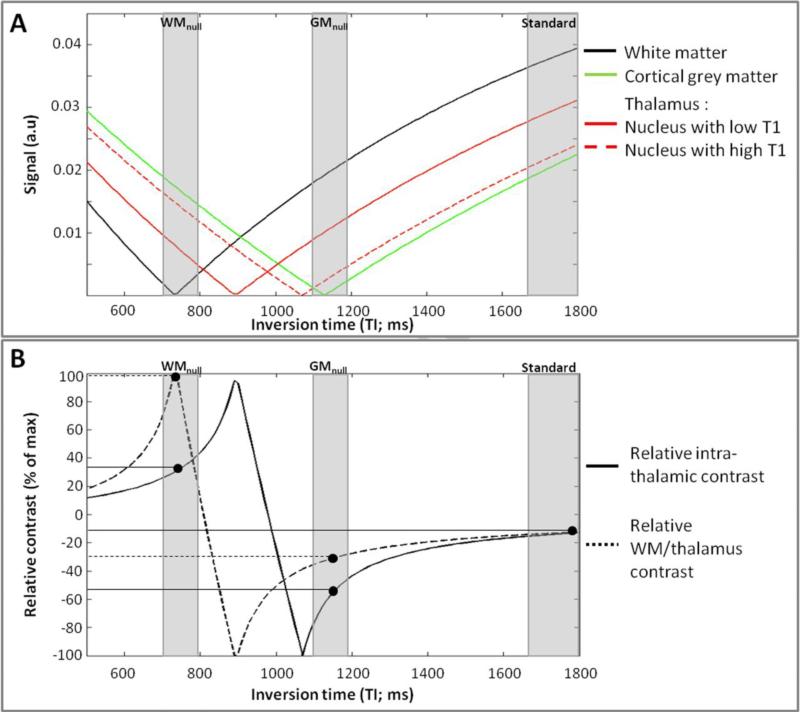
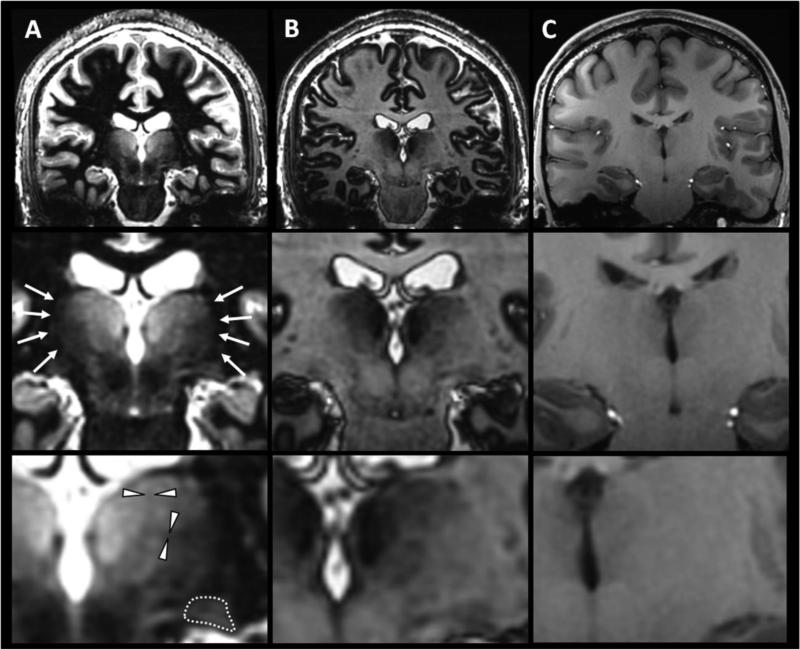
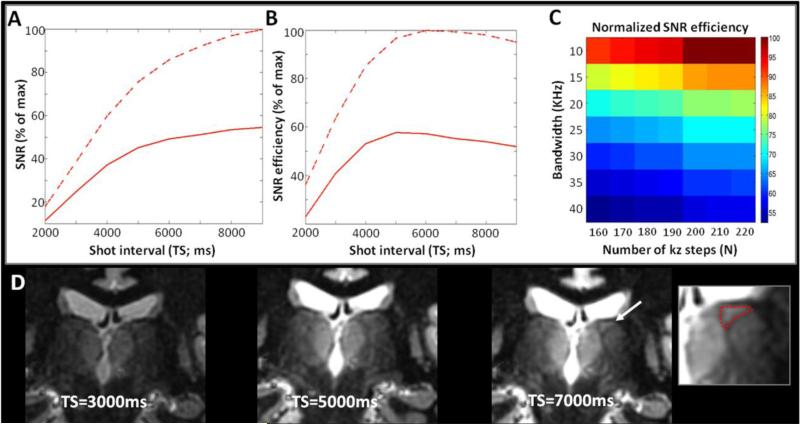
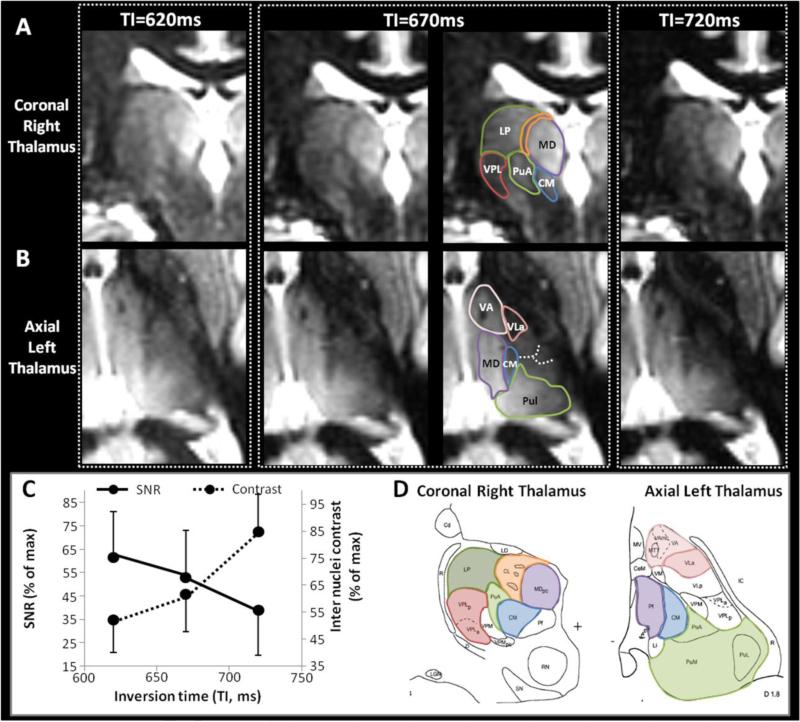
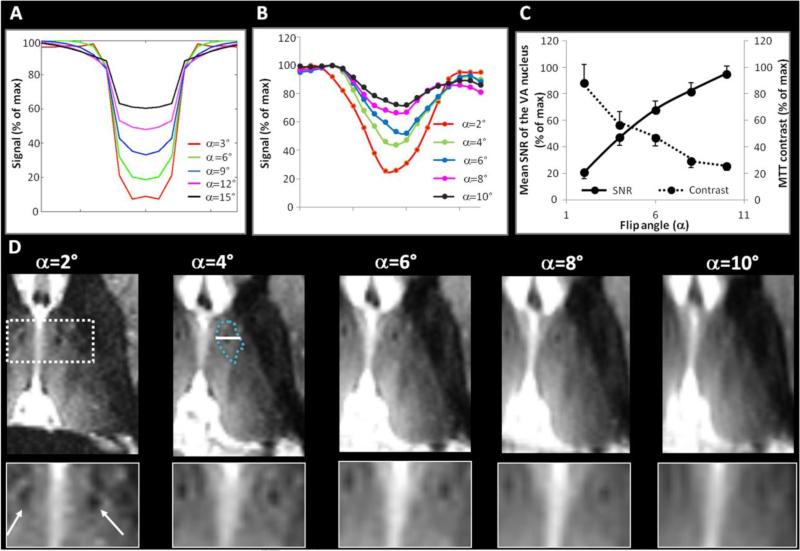
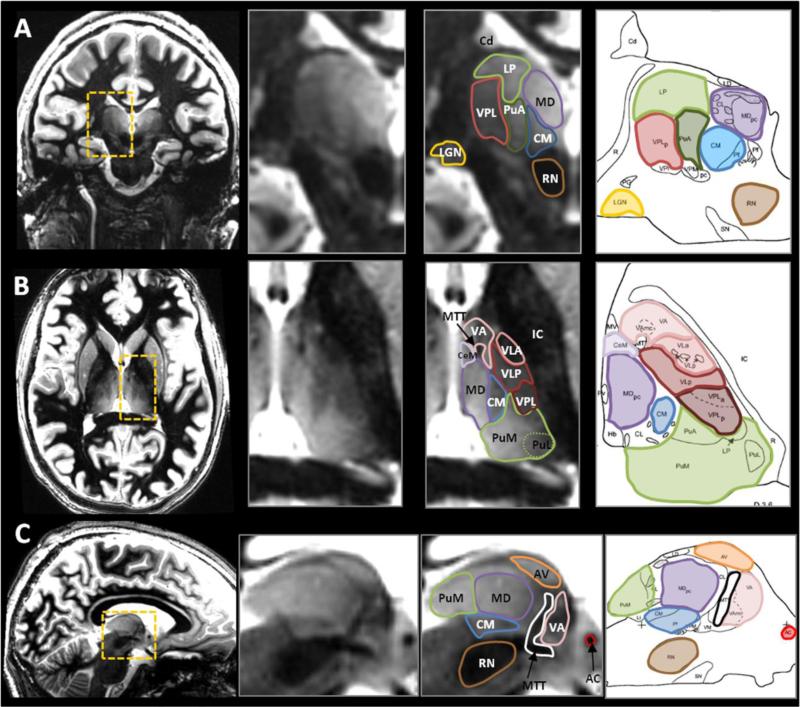
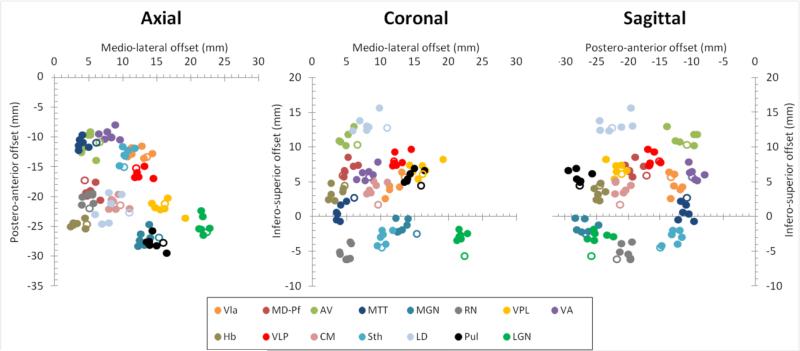
Novel MR image acquisition strategies have been investigated to elicit contrast within the thalamus, but direct visualization of individual thalamic nuclei remains a challenge because of their small size and the low intrinsic contrast between adjacent nuclei. We present a step-by-step specific optimization of the 3D MPRAGE pulse sequence at 7T to visualize the intra-thalamic nuclei. We first measured T1 values within different sub-regions of the thalamus at 7T in 5 individuals. We used these to perform simulations and sequential experimental measurements (n=17) to tune the parameters of the MPRAGE sequence. The optimal set of parameters was used to collect high-quality data in 6 additional volunteers. Delineation of thalamic nuclei was performed twice by one rater and MR-defined nuclei were compared to the classic Morel histological atlas. T1 values within the thalamus ranged from 1400ms to 1800ms for adjacent nuclei. Using these values for theoretical evaluations combined with in vivo measurements, we showed that a short inversion time (TI) close to the white matter null regime (TI=670ms) enhanced the contrast between the thalamus and the surrounding tissues, and best revealed intra-thalamic contrast. At this particular nulling regime, lengthening the time between successive inversion pulses (TS=6000ms) increased the thalamic signal and contrast and lengthening the α pulse train time (N*TR) further increased the thalamic signal. Finally, a low flip angle during the gradient echo acquisition (α=4°) was observed to mitigate the blur induced by the evolution of the magnetization along the α pulse train. This optimized set of parameters enabled the 3D delineation of 15 substructures in all 6 individuals; these substructures corresponded well with the known anatomical structures of the thalamus based on the classic Morel atlas. The mean Euclidean distance between the centers of mass of MR- and Morel atlas-defined nuclei was 2.67mm (±1.02mm). The reproducibility of the MR-defined nuclei was excellent with intraclass correlation coefficient measured at 0.997 and a mean Euclidean distance between corresponding centers of mass found at first versus second readings of 0.69mm (±0.38mm). This 7T strategy paves the way to better identification of thalamic nuclei for neurosurgical planning and investigation of regional changes in neurological disorders.

Keywords: 7T; AV; Anterior ventral nucleus; CM; CNR; COM; CSF; Center median nucleus; Center of mass; Cerebro-spinal fluid; Contrast-to-noise ratio; Delay time; GM; Gray matter; Habenular nucleus; Hb; ICC; Intraclass correlation coefficient; Inversion time; LD; LGN; Lateral dorsal nucleus; Lateral geniculate nucleus; MD; MGN; MPRAGE sequence; MTT; Magnetization-prepared rapidly-acquired gradient echo sequence; Mammillothalamic tract; Medial geniculate nucleus; Mediodorsal nucleus; Pul; Pulvinar; RN; ROI; Red nucleus; Region-of-interest; SNR; Shot interval time; Signal-to-noise ratio; Sth; Subthalamic nucleus; TD; TI; TS; Thalamic nuclei; Thalamus; Ultra high field; VA; VLa; VLp; VPL; Ventral anterior nucleus; Ventral lateral anterior nucleus; Ventral lateral posterior nucleus; Ventral posterior lateral nucleus; WM; White matter; White matter nulled MPRAGE.


Figures

Figure 1
Figure 1. T1 map and locations of the intra-thalamic regions of interest (ROI)
A representative T1 map is shown (A) with an enlarged view of the left thalamus without (B) and with regions-of-interest (ROI) (C). The corresponding plate of the Morel atlas (Morel et al., 1997) is shown for anatomic correspondence (D) (abbreviations as described in Methods). The mean T1 values and their corresponding across-subject standard deviations for the 5 volunteers are plotted in (E, see also supplemental table). The colors of the ROI and of the segments on the plot match the colors used on the atlas plate.
Figure 2
Figure 2. Global regime of contrast - Simulations
The signal intensity was simulated as a function of TI (A) with the other MR parameters as described for in vivo experiments in Figure 3 and with the T1/PD values as described in Results (T1 measurements) and Table 1. The corresponding intra-thalamic relative contrast and the relative contrast between the external thalamus (exhibiting the lower T1 values) and the surrounding WM are shown in (B). The contrast between structures A and B was defined as (A-B)/(A+B) rather than (A-B)/A to avoid divide-by-zero effects. From these simulations, the standard MPRAGE (close to the CSF null regime) provides good signal but poor contrast within the thalamus and between the thalamus and the surrounding WM. The WM null regime yields about 38% increase of the maximum intra-thalamic signal compared to the GM null regime and the best contrast between the external thalamus and the surrounding WM while staying close to one of the peaks for intra-thalamic contrast.
Figure 3
Figure 3. Global regime of contrast – In vivo data
Representative images at the WM null regime (A), GM null regime (B) and with a standard MPRAGE protocol close to the CSF null regime (C). The acquisition parameters for (A) and (B) were TS=5000ms, TI=730ms and 1080ms respectively, N=200, BW=25KHz, TR=9.8ms, TE=4ms, α =4°, resolution=1mm3, ARC acceleration factor=2.5, NEX=1, scan time=6.8min. The standard MPRAGE protocol (C) recommended for morphometric analysis (Jack et al., 2008) was acquired with TS=3700ms, TI=1200ms, N=220, BW=15KHZ, TR=5.4ms, TE=2.4ms, α =10°, resolution 1mm3, ARC acceleration factor=2.5, scan time=5 min. In line with simulations, the higher signal and the better delineation of the external boundaries of the thalamus (arrows in (A) and dotted line at higher magnification delineating the lateral geniculate nucleus from the surrounding WM) were striking at the WM null regime compared to the GM null regime. Some thin hypointense boundaries believed to be attenuated WM lamellae separating adjacent nuclei, were only visible in the WM null regime (arrowheads at higher magnification). For comparison, the standard MPRAGE contrast provided a classical T1 weighted image but with still lower thalamic contrast (C). The WM null regime was preferred for the next steps of the optimization for thalamus segmentation.
Figure 4
Figure 4. Optimization of TS - N and BW - Signal
The SNR (A) and SNR efficiency (B) were simulated as a function of TS effected by changing TD at the WM null regime with the MR parameters as described for (D) and with the higher range of intra-thalamic T1 (dashed) and the lower range of intra-thalamic T1 (solid), similar to Figure 2 and as measured in Figure 1. The signal and signal efficiency were normalized to the maximum values. From the simulations, the signal is expected to increase along TS and the signal efficiency is expected to reach a plateau around TS=6000ms. At the optimal TS of 6000ms, the map of SNR efficiency as a function of N and bandwidth (C) predicted higher SNR efficiency for higher N and lower bandwidth. (D): Representative images acquired at three TS=3000ms, 5000ms and 7000ms, with TI computed to stay at the WM null regime in each case. Other parameters fixed at N=200, BW=20KHz, TR=9.8ms, TE=4ms, α =4°, resolution=1mm3, ARC acceleration factor=2.5, NEX=1. Scan time=4.1min, 6.8min, and 9.6min respectively. The images are displayed at the same window and level. The experiments confirmed the gain in signal and contrast with TS. Structures such as the triangle of the lateral dorsal nucleus (LD; arrow and enlarged view at TS=7000ms) only became clearly visible at longer TS. The WM null regime at TS=6000ms, N=200 and BW=20KHz was preferred for the next steps of the optimization for thalamus segmentation.
Figure 5
Figure 5. Fine optimization of TI
Different TI were tested around the WM nulling point for TS=6000ms. Representative coronal images of the right thalamus (A) and axial images of the left thalamus (B) at three different TIs close to the WM nulling point, as noted. Other parameters fixed at TS=6000ms, N=200, BW=15KHz, TR=10.2ms, TE=4.4ms, α =4°, resolution=1mm3, ARC acceleration factor=2.5, NEX=1, scan time=8.2min. TI=670ms is shown without and with annotations. The average SNR and the average contrast between multiple pairs of adjacent nuclei were measured for each condition and plotted in (C). The corresponding histological plates from the Morel atlas (Morel et al., 1997) are shown for anatomic correspondence in (D). From the simulations (see Figure 2A and 2B), the thalamic signal was expected to decrease with longer TI around the WM null regime, but the intra-thalamic contrast (relative difference between the signal curves for nuclei with low and higher T1 values) was expected to increase for longer TI around the WM null regime. Experimentally, the trade-off between thalamic signal and contrast along TI was confirmed (C). Several nuclei were better delineated at TI 670ms. For example, on the coronal view (A and D) the hyperintensity of LP (green) and MD (purple) was distinct from the more hypointense VPL (red), CM (blue) and CL (orange). Also, a thin hypointense border allowed a clear delineation of the PuA (green) that was not possible at TI=620ms due to insufficient contrast, nor at TI=720ms, due to insufficient signal. Similarly, on axial views (B and D), the thin hypointense border delineating VA (pink) was better seen at TI=670ms. Same observation for the hypointense triangle corresponding to VLa (dark pink) seen at TI=670ms (and to a lesser extent at TI=620ms) but not individualized at TI=720ms due to the loss of signal from the adjacent posterior nuclei. Some subtle boundaries were also made out (dashed lines) and will be better emphasized by scanning without parallel imaging. The WM null regime at TS=6000ms and TI=670ms was preferred for the next steps of the optimization for thalamus segmentation.
Figure 6
Figure 6. Optimization of the flip angle (α)
Simulated signal at the WM null regime of a structural 1D phantom consisting of few pixels of WM between larger regions of thalamic-like tissue (A), with the MR parameters as described for (D). Signal intensity profile measured along a line crossing the mammillothalamic tract (MTT, B) as illustrated on the α =4° image in (D). In (A) and (B) the signal was normalized to the maximum value for each α. The SNR and the contrast of the MTT, a surrogate for image blur (see Methods), were also measured for each condition and plotted in (C). Representative images acquired at five different α (D), with the other parameters fixed at TS=6000ms, TI=670ms, N=200, BW=20KHz, TR=6.9ms, TE=3.0ms, resolution=1mm3, ARC acceleration factor=2.5, NEX=1, scan time=8.2min. The images are axial reconstructions from a coronal acquisition and are displayed at the same window and level. Enlarged views of the mammillothalamic tract (MTT, arrows) are shown for each α. From the simulations (A), the signal of a small structure embedded in another tissue is expected to progressively fade at higher α (shallower profile and gentler slope). This effect was particularly relevant experimentally with increased blur along the slice direction (antero-posterior) that obscured small structures embedded in a larger region, such as the MTT or the small hypointense borders delineating adjacent nuclei (the hypointense border of the ventral anterior nucleus was delineated in cyan at α =4° for illustration). The signal profile of the MTT measured experimentally matched the simulations (B) and the trade-off between thalamic signal and blur along α was confirmed (C). α =4° represented the best trade-off to keep these thin structures visible with sufficient signal. The WM null regime at TS=6000ms, TI=670ms, and α =4° was preferred for the optimization for thalamus segmentation.
Figure 7
Figure 7. Visualization of thalamic nuclei compared with histological plates
Representative examples of MR scans in the 3 orthogonal orientations (each orientation shown in a different volunteer) and presented with the corresponding histological plates (Morel et al., 1997). Several nuclei can be identified thanks to enhanced intrinsic contrast between adjacent structures. Also, thin hypointense bands helped to isolate structures with otherwise close signal. For example, see the thin boundaries around the pulvinar anterior (PuA, green) in coronal (A), around the ventral anterior nucleus (VA, pink) in axial (B), and around the anterior ventral nucleus (AV, orange) in sagittal (C). Good correspondence between MR boundaries and the atlas can be observed.
Figure 8
Figure 8. Scatter plots of MR-based and atlas-based center of mass of thalamic nuclei
The Talairach center of mass (COM) coordinates of 15 structures (abbreviations as described in the Methods) in 6 volunteers are plotted in axial, coronal and sagittal projections. The atlas-based Talairach COM coordinates are shown with open icons. The middle of the anterior commissure is at the origin (0,0,0). Good agreement was observed between the individuals and with the atlas.

References

    1. Abosch A, Yacoub E, Ugurbil K, Harel N. An assessment of current brain targets for deep brain stimulation surgery with susceptibility-weighted imaging at 7 tesla. Neurosurgery. 2010;67:1745–1756. discussion 1756. - PMC - PubMed
    1. Barral JK, Gudmundson E, Stikov N, Etezadi-Amoli M, Stoica P, Nishimura DG. A robust methodology for in vivo T1 mapping. Magnetic Resonance in Medicine. 2010;64:1057–1067. - PMC - PubMed
    1. Behrens TE, Johansen-Berg H, Woolrich MW, Smith SM, Wheeler-Kingshott CA, Boulby PA, Barker GJ, Sillery EL, Sheehan K, Ciccarelli O, Thompson AJ, Brady JM, Matthews PM. Non-invasive mapping of connections between human thalamus and cortex using diffusion imaging. Nat Neurosci. 2003;6:750–757. - PubMed
    1. Bender B, Manz C, Korn A, Nagele T, Klose U. Optimized 3D magnetization-prepared rapid acquisition of gradient echo: identification of thalamus substructures at 3T. AJNR Am J Neuroradiol. 2011;32:2110–2115. - PMC - PubMed
    1. Bock NA, Hashim E, Janik R, Konyer NB, Weiss M, Stanisz GJ, Turner R, Geyer S. Optimizing T1-weighted imaging of cortical myelin content at 3.0 T. Neuroimage. 2013;65:1–12. - PubMed

Publication types