. 2013 Oct;91(9):545-55.
doi: 10.1038/icb.2013.38. Epub 2013 Sep 10.

Inactivation of tumor-specific CD8⁺ CTLs by tumor-infiltrating tolerogenic dendritic cells

Affiliations

Inactivation of tumor-specific CD8⁺ CTLs by tumor-infiltrating tolerogenic dendritic cells

Hirotomo Harimoto et al. Immunol Cell Biol. 2013 Oct.

Erratum in

  • Immunol Cell Biol. 2013 Nov-Dec;91(10):665

Abstract

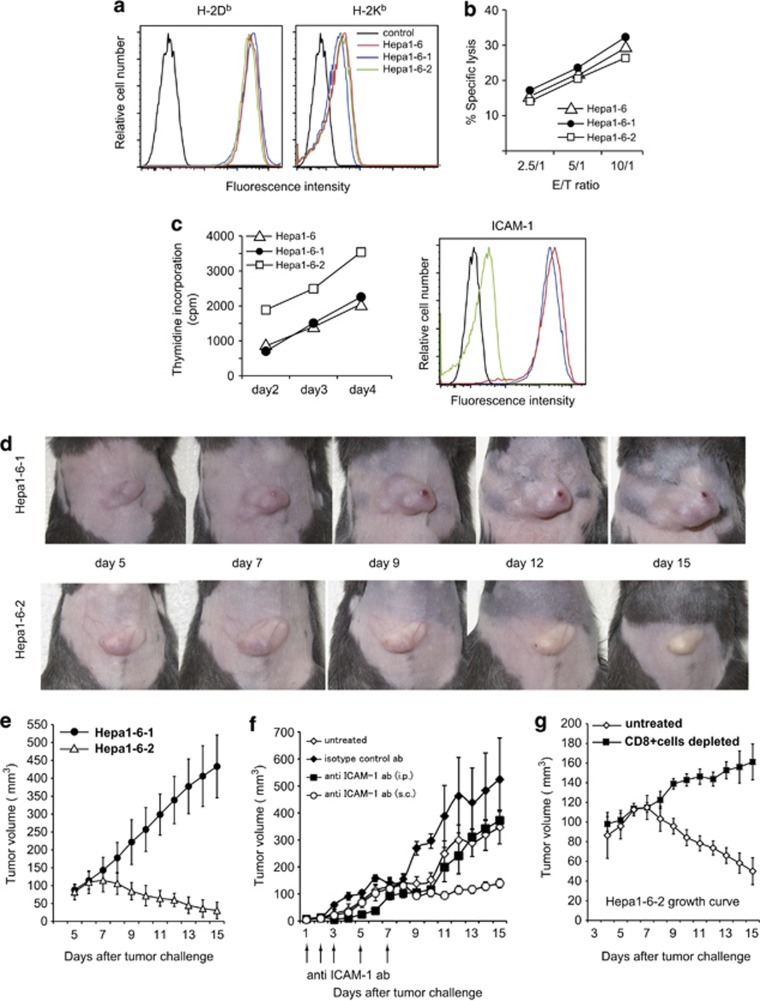
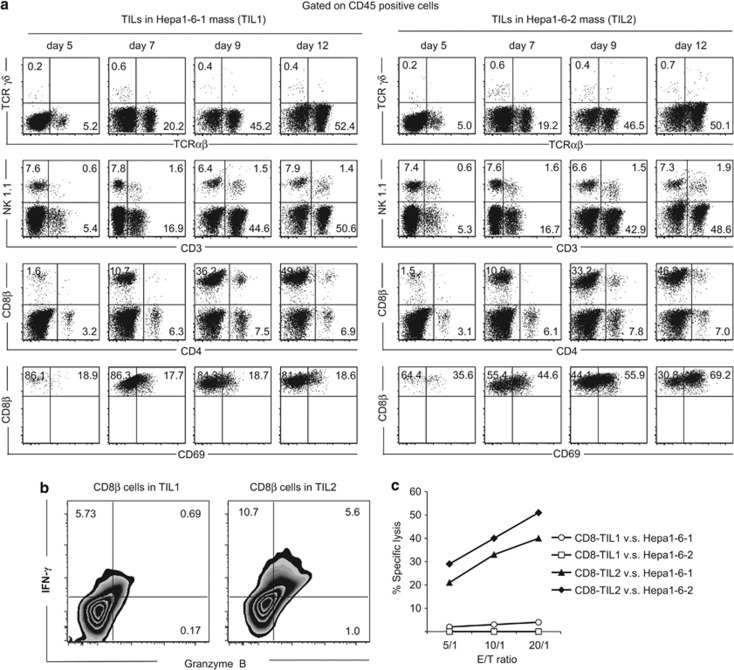
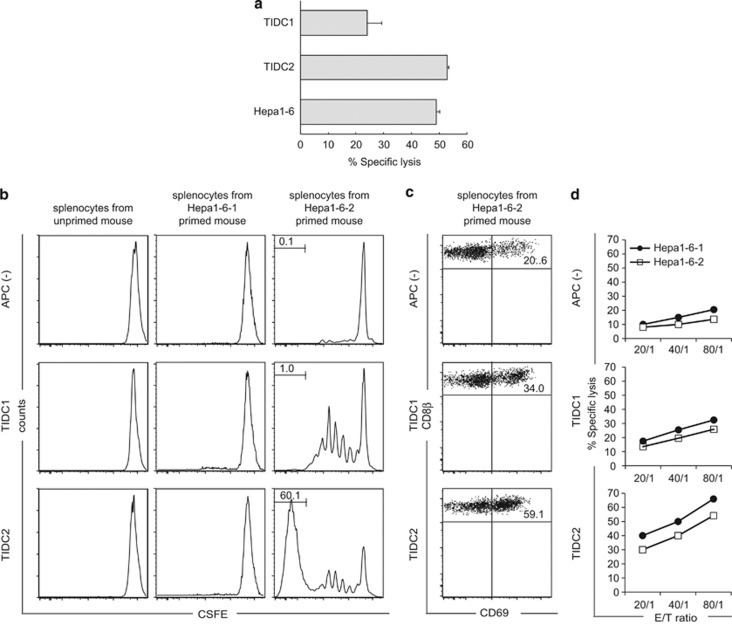
Cancer immunosurveillance failure is largely attributed to the insufficient activation of tumor-specific class I major histocompatibility complex (MHC) molecule (MHC-I)-restricted CD8⁺ cytotoxic T lymphocytes (CTLs). DEC-205⁺ dendritic cells (DCs), having the ability to cross-present, can present captured tumor antigens on MHC-I alongside costimulatory molecules, inducing the priming and activation of tumor-specific CD8⁺ CTLs. It has been suggested that reduced levels of costimulatory molecules on DCs may be a cause of impaired CTL induction and that some tumors may induce the downregulation of costimulatory molecules on tolerogenic DCs. To examine such possibilities, we established two distinct types of murine hepatoma cell lines, named Hepa1-6-1 and Hepa1-6-2 (derived from Hepa1-6 cells), and confirmed that they display similar antigenicities, as well as identical surface expression of MHC-I. We found that Hepa1-6-1 had the ability to grow continuously after subcutaneous implantation into syngeneic C57BL/6 mice and did not prime CD8⁺ CTLs. In contrast, Hepa1-6-2 cells, which display reduced levels of adhesion molecules, such as Intercellular Adhesion Molecule 1 (ICAM-1), failed to grow in vivo and efficiently primed CTLs. Moreover, Hepa1-6-1-derived factors, such as transforming growth factor (TGF)-β1, vascular endothelial growth factor (VEGF) and α-fetoprotein (AFP), converted CD11c(high) MHC-II(high) DEC-205⁺ DC subsets into tolerogenic cells, displaying downregulated costimulatory molecules and having impaired cross-presenting capacities. These immunosuppressive tolerogenic DCs appeared to inhibit the induction of tumor-specific CD8⁺ CTLs and suppress their cytotoxic functions within the tumor. Together, the findings presented here provide a new method of cancer immunotherapy using the selective suppression, depletion or alteration of immunosuppressive tolerogenic DCs within tumors.


Figures

Figure 1
Figure 1
Analysis of two distinct hepatoma cell lines, Hepa1-6-1 and Hepa1-6-2, established from the known murine hepatoma cell line, Hepa1-6. (a) To confirm whether the established cell lines Hepa1-6-1 and Hepa1-6-2 expressed similar class I MHC molecules, the established lines were stained with antibodies against H-2Kb or H-2Db. Blue lines indicate Hepa1-6-1, green lines Hepa1-6-2, red lines original Hepa1-6 and black lines isotype controls. (b) To determine whether the established cell lines or original Hepa1-6 could be eliminated by Hepa1-6-specific CD8+ CTLs in vitro, a standard 51Cr-release assay against the tumor cells was performed. (c) To evaluate the rate of growth of the established cell lines, a standard 3H-thymidine uptake assay was performed (left panel). Additionally, to examine the expression of adhesion molecules, such as ICAM-1, the established cell lines were stained with an anti-ICAM-1-specific mAb (right panel). Blue line indicates Hepa1-6-1, green line Hepa1-6-2, red line Hepa1-6 and black line isotype controls. (d) To observe the growth kinetics for both tumors, 1 × 10⁷ tumor cells were s.c. implanted into syngeneic C57BL/6 mice (six per group) in the abdominal region. (e) To estimate the volume of the growing tumor mass, the diameter of both length (a) and width (b) were measured every day until day 15 after the implantation, and the tumor volume (V) was calculated according to the formula V=ab2/2. Data are shown as the mean±s.e.m. of mice per group (n=6). (f) Mice were injected s.c. (open circle) or intraperitoneally (i.p.) (closed square) with anti-ICAM-1-specific antibody 1, 2, 3, 5 and 7 days after the Hepa1-6-1 administration, and the tumor volume (V) was pursued. Data are shown as the mean±s.e.m. of mice per group (n=6). (g) To confirm that the effector cells mediating tumor regression were primarily CD8+ cells, C57BL/6 mice were i.p. injected twice with 400 μg anti-Lyt2, and then 1 × 10⁶ Hepa1-6-2 cells were s.c. implanted and monitored for volume through day 15. Data are shown as the mean±s.e.m. of mice per group (n=6).
Figure 2
Figure 2
Percentages of CD69+-activated TILs within Hepa1-6-1 cells (left 4 lines) and Hepa1-6-2 cells (right 4 lines). (a) At 5, 7, 9 and 12 days after implantation, emerged tumor masses were excised and digested with collagenase, and single-cell suspensions were obtained. CD45+ cells were considered to be infiltrating cells but not tumor-derived cells, and thus further kinetic analyses on cell-surface markers were performed by including CD45+ cells within the TIL gates; line 1, TCRαβ and TCRγδ line 2, NK1.1 and CD3; line 3, CD8β and CD4; line 4, CD69 percentage among CD8β+ cells. Representative plots from six independent experiments are shown. To evaluate the functional differences between Hepa1-6-1-associated CD8+ TILs and Hepa1-6-2-associated TILS, both types of tumor cells were s.c. injected into different groups of syngeneic C57BL/6 mice. (b) Ten days after tumor implantation, the tumor-bearing mice were injected i.p. with 250 ng of brefeldin-A to stop intracellular trafficking. Four hours later, TILs were immediately isolated, stained for surface CD8β expression, and then fixed and permeabilized for intracellular staining with PE-conjugated anti-IFN-γ and FITC-conjugated anti-granzyme B. Representative plots from six independent experiments are shown. (c) Ten days following tumor implantation, emerged tumor masses were excised and digested with collagenase, and single-cell suspensions were obtained. Immediately, TIL suspensions were incubated with PE-labeled anti-CD8, followed by a PE-selecting cocktail and nanoparticles, and the samples were positively sorted using an immunomagnetic system, after which CD8+ TILs from both groups were obtained. The obtained CD8+ TILs were further incubated with IL-2 at 37 °C for 24 h, and a standard 51Cr-release assay on the tumor cells was performed. Representative plots from six independent experiments are shown.
Figure 3
Figure 3
Costimulatory molecule expression on TIDCs within Hepa1-6-1 tumor masses is downregulated. (a) A number of CD11chigh MHC-IIhigh DCs among the CD45+ population infiltrated into the masses of both Hepa1-6-1 (TIL1) and Hepa1-6-2 (TIL2) tumors. (b) These populations were further divided into two subpopulations: CD11chigh MHC-IIhigh and CD11cint MHC-IIlow (as indicated in the squares of the left two panels). The majority of the CD11chigh MHC-IIhigh population was composed of DEC-205+ DCs (middle two panels), whereas the CD11cint MHC-IIlow cells were largely DEC− (right two panels). The percentage of CD11chigh MHC-IIhigh DEC-205+ DCs in TILs for both tumors was approximately equal. (c) CD11b and Ly6C expression on CD11chigh MHC-IIhigh TIDCs to see whether they originate from tissue-resident or from inflammatory DCs. (d) The expression of PD-L1 on CD11chigh MHC-IIhigh DCs in Hepa1-6-1 (TIDC1) and Hepa1-6-2 (TIDC2) tumor masses was examined. Representative graphs from six independent experiments are shown. (e) The expression of the costimulatory molecules CD40, CD80 and CD86 on CD11chigh MHC-IIhigh DCs in Hepa1-6-1 (TIDC1) and Hepa1-6-2 (TIDC2) tumor masses was examined. Representative graphs from six independent experiments are shown.
Figure 4
Figure 4
Effect of CD11chigh MHC-IIhigh DEC-205+ DC subsets within either Hepa1-6-1 or Hepa1-6-2 tumor masses on the induction of CD8+ CTLs from primed splenic T cells. (a) Hepa1-6-specific CD8+ CTLs were incubated with 3 × 10³ 51Cr-labeled CD11chigh MHC-IIhigh DEC-205+ TIDC1, TIDC2 and Hepa1-6 cells for 4 h at 37 °C in round-bottom 96-well cell culture plates. After incubation, the plates were centrifuged for 10 min at 330 × g, and 100 μl of cell-free supernatants was collected to measure radioactivity. Data are shown as the mean±s.e.m. of cells per group (n=4). (b) Carboxyfluorescein diacetate succinimidyl ester-labeled splenic T cells from unprimed mice (left three panels), Hepa1-6-1-primed mice (middle vertical three panels) or Hepa1-6-2-primed mice (right three panels) were stimulated for 4 days with CCM alone (upper three panels), with Hepa1-6-1-associated CD11chigh MHC-IIhigh DC (TIDC1) (middle horizontal three panels) or with Hepa1-6-2-associated CD11chigh MHC-IIhigh DC (TIDC2) (lower three panels). The cocultured cells were then harvested, gated to CD8β cells and analyzed to determine the number of cell divisions using flow cytometry. (c) Hepa1-6-2-primed splenic T cells were stimulated for 4 days with CCM alone (upper panel), with TIDC1 (middle panel), or with TIDC2 (lower panel), and CD69 expression among CD8+ cells was analyzed. (d) TIDC2-activated Hepa1-6-primed T cells showed specific cytotoxicity against both Hepa1-6-1 and Hepa1-6-2 cells at equal rates (lower panel), whereas TIDC1-activated Hepa1-6-primed T cells showed no cytotoxicity against either Hepa1-6-1 or Hepa1-6-2 cells (middle panel), similar to the control (upper panel). Representative graphs from five independent experiments are shown.
Figure 5
Figure 5
Hepa1-6-1-derived factors downregulate costimulatory molecule expression on DCs. (a) The amounts of AFP, VEGF and TGF-β in the culture supernatant of Hepa1-6-1 or Hepa1-6-2 cells were measured. Data are shown as the mean±s.e.m. per group (n=5). (b) One million bone marrow-derived immature DCs (BM-iDCs) from syngeneic C57BL/6 mice were cocultured with 10% conditioned medium from Hepa1-6-1 or Hepa1-6-2 cells for 5 days with GM-CSF and subsequently evaluated for the expression of CD80, CD86 and CD40. Data are shown as the mean±s.e.m. of cells per group (n=5). *P<0.05, **P<0.005, Student's t-test.
Figure 6
Figure 6
Effect of simultaneous implantation or pre-administration of Hepa1-6-2 cells on Hepa1-6-1 tumor growth. (a) The effect of simultaneous co-implantation of Hepa1-6-1 in the right abdominal region and Hepa1-6-2 in the opposite left abdominal region on tumor growth was examined. Representative data from four independent experiments are shown. (b) CD69 expression and cytotoxic activity of CD8+ TILs within Hepa1-6-1 and Hepa1-6-2 masses were examined 9 days after co-implantation. Representative data from four independent experiments are shown. (c) Effect of pre-administration of Hepa1-6-2 cells in the right abdominal region on the growth of Hepa1-6-1 implantation in the same (right) side or in the opposite (left) side was analyzed at various time points. Data are shown as the mean±s.e.m. of mice per group (n=4).

Similar articles

Cited by

References

    1. Zinkernagel RM, Doherty PC. Restriction of in vitro T cell-mediated cytotoxicity in lymphocytic choriomeningitis within a syngeneic or semiallogeneic system. Nature. 1974;248:701–702. - PubMed
    1. Tsang KY, Zhu M, Even J, Gulley J, Arlen P, Schlom J. The infection of human dendritic cells with recombinant avipox vectors expressing a costimulatory molecule transgene (CD80) to enhance the activation of antigen-specific cytolytic T cells. Cancer Res. 2001;61:7568–7576. - PubMed
    1. Moriya K, Wakabayashi A, Shimizu M, Tamura H, Dan K, Takahashi H. Induction of tumor-specific acquired immunity against already established tumors by selective stimulation of innate DEC-205(+) dendritic cells. Cancer Immunol Immunother. 2010;59:1083–1095. - PMC - PubMed
    1. Germain RN. MHC-dependent antigen processing and peptide presentation: providing ligands for T lymphocyte activation. Cell. 1994;76:287–299. - PubMed
    1. Takahashi H. Antigen processing and presentation. Microbiol Immunol. 1993;37:1–9. - PubMed

Publication types

MeSH terms