. 2013 Sep 9;368(1628):20130057.
doi: 10.1098/rstb.2013.0057. Print 2013 Oct 19.

Reach preparation enhances visual performance and appearance

Affiliations

Reach preparation enhances visual performance and appearance

Martin Rolfs et al. Philos Trans R Soc Lond B Biol Sci. .

Abstract

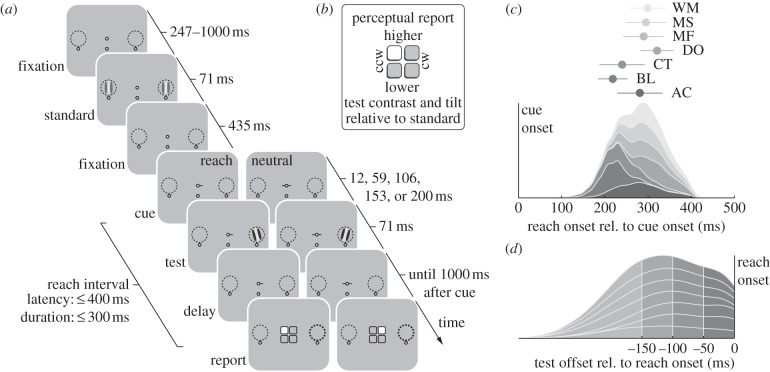
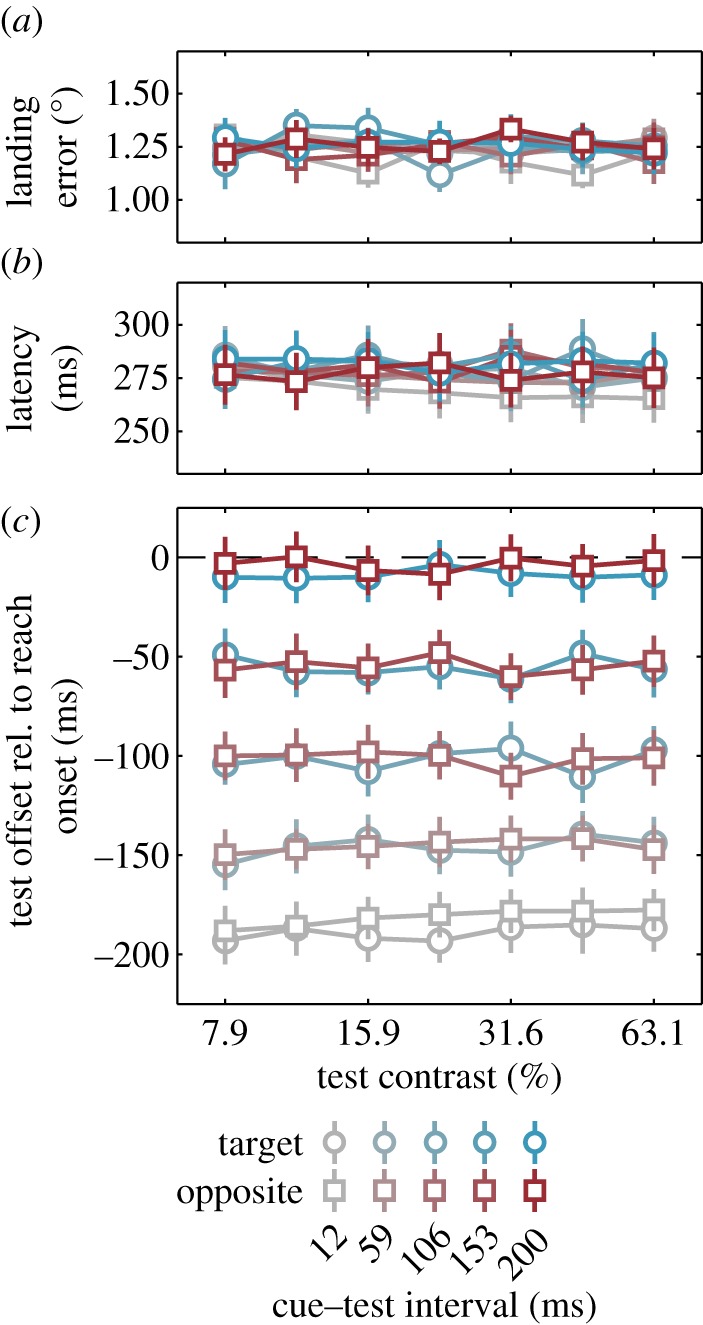
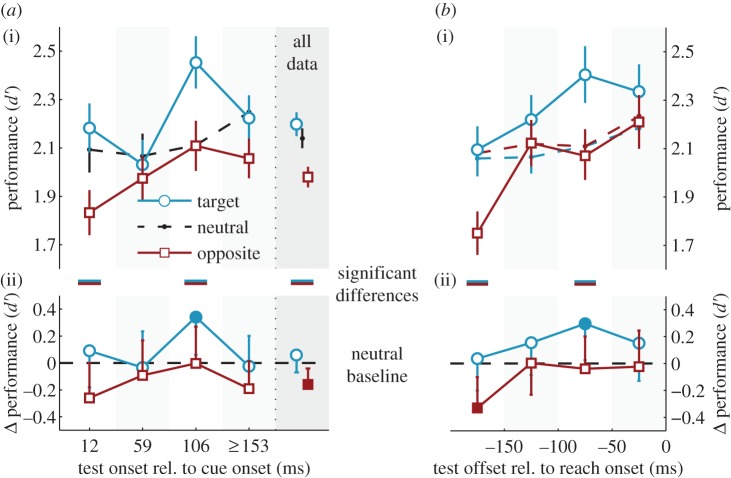
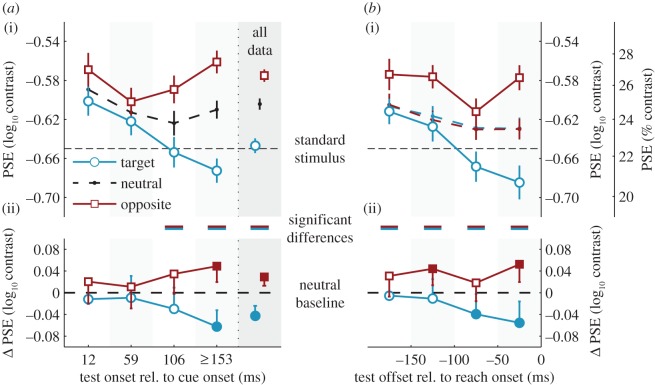
We investigated the impact of the preparation of reach movements on visual perception by simultaneously quantifying both an objective measure of visual sensitivity and the subjective experience of apparent contrast. Using a two-by-two alternative forced choice task, observers compared the orientation (clockwise or counterclockwise) and the contrast (higher or lower) of a Standard Gabor and a Test Gabor, the latter of which was presented during reach preparation, at the reach target location or the opposite location. Discrimination performance was better overall at the reach target than at the opposite location. Perceived contrast increased continuously at the target relative to the opposite location during reach preparation, that is, after the onset of the cue indicating the reach target. The finding that performance and appearance do not evolve in parallel during reach preparation points to a distinction with saccade preparation, for which we have shown previously there is a parallel temporal evolution of performance and appearance. Yet akin to saccade preparation, this study reveals that overall reach preparation enhances both visual performance and appearance.

Keywords: attention; intention; manual reach; movement preparation; priority.


Figures

Figure 1.
Figure 1.
Reach set-up. Observers sat with their head stabilized and their arms comfortably positioned on an elbow cup. An eye tracker constantly monitored fixation, and a touch screen registered the finger's reach position.
Figure 2.
Figure 2.
Experimental procedure, reach and test stimulus timing. (a) Sequence of events in each trial. As soon as gaze and reach were detected near their respective fixation marks, standard stimuli briefly appeared within two placeholders, 7.5° to the left and to the right of fixation, followed by a movement cue and, after a variable delay, a test stimulus that appeared unpredictably at either of the two stimulus locations. In the reach condition, the cue indicated the reach target (one circle below each stimulus location), and observers executed the reach quickly. In this example, the test stimulus is presented at the reach target. In the neutral condition, the cue pointed in both directions and observers maintained reach fixation. Times indicate durations of the depicted frames. (b) Perceptual report. When the observer executed an appropriate reach, a response screen appeared, asking observers to report in a single touch of the screen the orientation and contrast of the test stimulus (a thick outline post-cued its location) relative to the standard. As a result of touching the screen, the selected button turned white. (c) Density plot of reach latencies, stacked for the seven observers tested. Markers and error bars show individual means and standard deviations. (d) Stacked individual density plot of test offset times. We divided the distribution in four time windows before reach onset. The earliest bin collapses all trials in which the test stimulus disappeared earlier than 150 ms before the reach onset.
Figure 3.
Figure 3.
Reach performance and test stimulus timing. (a) Average landing site error, (b) reach latency and (c) test timing relative to reach onset, plotted for each CTI, test location relative to the reach target and test contrast. Error bars are s.e.m. (Online version in colour.)
Figure 4.
Figure 4.
Orientation discrimination performance, expressed as d′, as a function of test stimulus location relative to the reach target (target or opposite) and time of test stimulus presentation, relative to both (a) cue onset and (b) reach onset. In a(i) and b(i) we show the average data with s.e.m. In a(ii) and b(ii) we re-plot the data from panels a(i) and b(i) as the difference of the two reach conditions from their neutral baseline, with 95% CIs. We constrained all analyses to trials in which the test stimulus presentation had been completed before the reach (§4d). In (a) therefore, the last time bin (greater than or equal to 153 ms) pools the 153 and 200 ms CTIs, because observers with short reach latencies had very few trials long after the cue. In ‘all data’, we computed d′ by pooling trials from all CTIs. In (b), neutral baselines were computed separately for the target and opposite conditions, and plotted in the corresponding colours (dashed lines). Filled symbols highlight significant deviations from baseline. Lines in between (i) and (ii) highlight significant differences between the two reach conditions (target versus opposite). (Online version in colour.)
Figure 5.
Figure 5.
Perceived contrast, expressed as PSEs, as a function of test stimulus location relative to the reach target and time of test stimulus presentation relative to both (a) cue onset, and (b) reach onset. Conventions as in figure 4. (Online version in colour.)

Similar articles

Cited by

References

    1. Fecteau JH, Munoz DP. 2006. Salience, relevance, and firing: a priority map for target selection. Trends Cogn. Sci. 10, 382–390 (doi:10.1016/j.tics.2006.06.011) - DOI - PubMed
    1. Serences JT, Yantis S. 2006. Selective visual attention and perceptual coherence. Trends Cogn. Sci. 10, 38–45 (doi:10.1016/j.tics.2005.11.008) - DOI - PubMed
    1. Gottlieb J. 2007. From thought to action: the parietal cortex as a bridge between perception, action, and cognition. Neuron 53, 9–16 (doi:10.1016/j.neuron.2006.12.009) - DOI - PubMed
    1. Bisley JW, Goldberg ME. 2010. Attention, intention, and priority in the parietal lobe. Annu. Rev. Neurosci. 33, 1–21 (doi:10.1146/annurev-neuro-060909-152823) - DOI - PMC - PubMed
    1. Awh E, Belopolsky AV, Theeuwes J. 2012. Top-down versus bottom-up attentional control: a failed theoretical dichotomy. Trends Cogn. Sci. 16, 437–443 (doi:10.1016/j.tics.2012.06.010) - DOI - PMC - PubMed

Publication types

LinkOut - more resources