Review
. 2013 Sep;195(1):9-36.
doi: 10.1534/genetics.113.153262.

Mapping yeast transcriptional networks

Affiliations
Review

Mapping yeast transcriptional networks

Timothy R Hughes et al. Genetics. 2013 Sep.

Abstract

The term "transcriptional network" refers to the mechanism(s) that underlies coordinated expression of genes, typically involving transcription factors (TFs) binding to the promoters of multiple genes, and individual genes controlled by multiple TFs. A multitude of studies in the last two decades have aimed to map and characterize transcriptional networks in the yeast Saccharomyces cerevisiae. We review the methodologies and accomplishments of these studies, as well as challenges we now face. For most yeast TFs, data have been collected on their sequence preferences, in vivo promoter occupancy, and gene expression profiles in deletion mutants. These systematic studies have led to the identification of new regulators of numerous cellular functions and shed light on the overall organization of yeast gene regulation. However, many yeast TFs appear to be inactive under standard laboratory growth conditions, and many of the available data were collected using techniques that have since been improved. Perhaps as a consequence, comprehensive and accurate mapping among TF sequence preferences, promoter binding, and gene expression remains an open challenge. We propose that the time is ripe for renewed systematic efforts toward a complete mapping of yeast transcriptional regulatory mechanisms.

Keywords: chromatin; gene expression; regulatory networks; transcription factors; yeast.


Figures

Figure 1
Figure 1
Distribution of TF binding events. (A) Histogram showing the number of TFs that bind to specific numbers of targets (ChIP probes). If a TF was assayed in multiple conditions, each condition is counted separately. (B) Histogram showing the number of targets (ChIP probes) that are bound by specific numbers of TFs, counting each condition under which a TF was tested separately. Data were derived from Harbison et al. (2004), using a 0.001 P-value cutoff (Harbison et al. 2004).
Figure 2
Figure 2
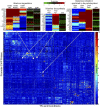
Two-dimensional hierarchical clustering analysis of ChIP-chip data (Harbison et al. 2004), encompassing 288 TF-condition combinations, 14 distinct conditions, and 155 distinct proteins. There are 5824 chip probes. Three examples of clusters are magnified on top, showing the bound genes (i.e., promoters) as well as the target TF and conditions of the ChIP experiment. Asterisks indicate the gene is part of the indicated pathway and gene labels in parentheses represent alternate probes for a promoter already listed. Also shown are expression data showing the changes resulting from deletion of the corresponding TFs (Hu et al. 2007). Missing data are represented by gray and black in the expression data and ChIP data, respectively.
Figure 3
Figure 3
TF autoregulation analysis. Shown is the observed percentage of autoregulatory interactions (of all TFs) minus the percentage expected by chance, when varying cutoff for the number of predicted targets (x-axis), for all TFs. Rank sum P-values are 0.003 and 5 × 10⁻⁷ for ChIP-chip and motif instances, respectively, comparing the ranks of autoregulatory binding vs. other promoter binding.
Figure 4
Figure 4
Clustering of the entire SPELL data set, containing gene expression microarray data from diverse sources (4803 genes by 7186 experiments). Selected prominent clusters are labeled with a GO process enriched among the genes within the cluster and/or the experimental conditions (italics) enriched within the cluster. Gray represents missing data.
Figure 5
Figure 5
Pipeline for QTL mapping. Two strains of yeast are mated and recombinant haploid progeny are isolated. Expression traits are typically quantified for each recombinant strain in isolation. Strains are genotyped and variable loci are tested to see how well the quantified trait correlates with each parental genotype.
Figure 6
Figure 6
Examples of cis-regulation by ncRNAs. Blue arrows represent ORFs, green arrows represent actively transcribed transcripts, red arrows represent repressed transcripts, and dashed red arrows represent transcripts repressed by interference from transcription of the nearby RNA. Example genes are from (Martens et al. 2004; Bird et al. 2006; Hongay et al. 2006; Camblong et al. 2007; Houseley et al. 2008; Nishizawa et al. 2008; Bumgarner et al. 2009; Xu et al. 2011; van Werven et al. 2012).
Figure 7
Figure 7
Illustration of three major interrelated maps of transcriptional regulation: motifs and other sequence features, physical binding or other measurements of in vivo activity at a promoter, and expression output.
Figure 8
Figure 8
Some of the factors that contribute to TF activity or nonactivity in a given promoter. To result in gene expression differences, a motif instance must be present, the TF must compete with nucleosomes and other TFs to bind the motif, and the binding of nearby cofactors is potentially required.
Figure 9
Figure 9
Using regression to predict gene expression. (A) A trivial example where the relationship between expression level (Egx) and TF binding to promoters (Bgf) is found for a single experiment (x) and a single TF (f). Here, the model learns two parameters: the background expression level for all genes in the experiment (F0x) and the activity of the transcription factor in the given experiment (Ffx). (B) The generalized equation for multiple factors and multiple experiments. (C) Matrix representations of the generalized equation. Baseline expression is the same for all genes and so is represented as a single vector multiplied by a row vector of constants where c = 1/(no. genes).

References

    1. Adams C. C., Workman J. L., 1995. Binding of disparate transcriptional activators to nucleosomal DNA is inherently cooperative. Mol. Cell. Biol. 15: 1405–1421. - PMC - PubMed
    1. Almer A., Rudolph H., Hinnen A., Horz W., 1986. Removal of positioned nucleosomes from the yeast PHO5 promoter upon PHO5 induction releases additional upstream activating DNA elements. EMBO J. 5: 2689–2696. - PMC - PubMed
    1. Aragon A. D., Rodriguez A. L., Meirelles O., Roy S., Davidson G. S., et al. , 2008. Characterization of differentiated quiescent and nonquiescent cells in yeast stationary-phase cultures. Mol. Biol. Cell 19: 1271–1280. - PMC - PubMed
    1. Arndt K., Fink G. R., 1986. GCN4 protein, a positive transcription factor in yeast, binds general control promoters at all 5′ TGACTC 3′ sequences. Proc. Natl. Acad. Sci. USA 83: 8516–8520. - PMC - PubMed
    1. Auerbach R. K., Euskirchen G., Rozowsky J., Lamarre-Vincent N., Moqtaderi Z., et al. , 2009. Mapping accessible chromatin regions using Sono-Seq. Proc. Natl. Acad. Sci. USA 106: 14926–14931. - PMC - PubMed

Publication types

MeSH terms

LinkOut - more resources