. 2013:4:2427.
doi: 10.1038/ncomms3427.

Tumour angiogenesis regulation by the miR-200 family

Affiliations

Tumour angiogenesis regulation by the miR-200 family

Chad V Pecot et al. Nat Commun. 2013.

Abstract

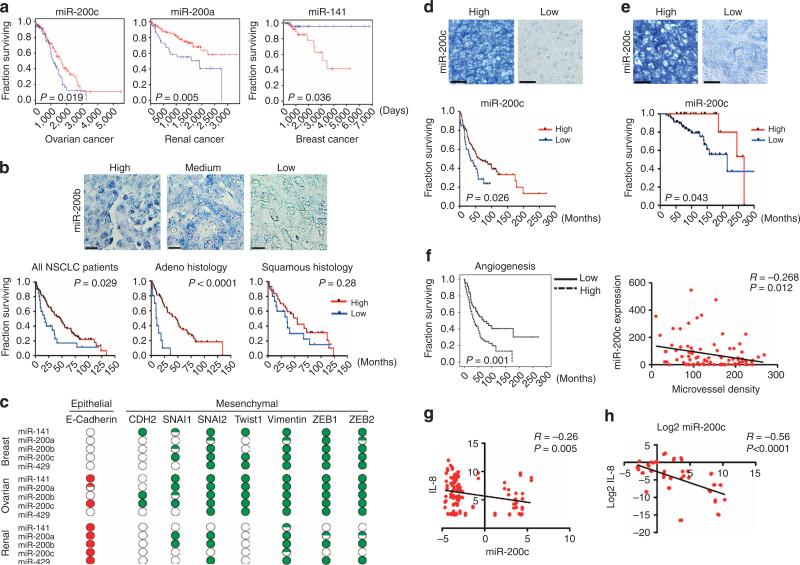
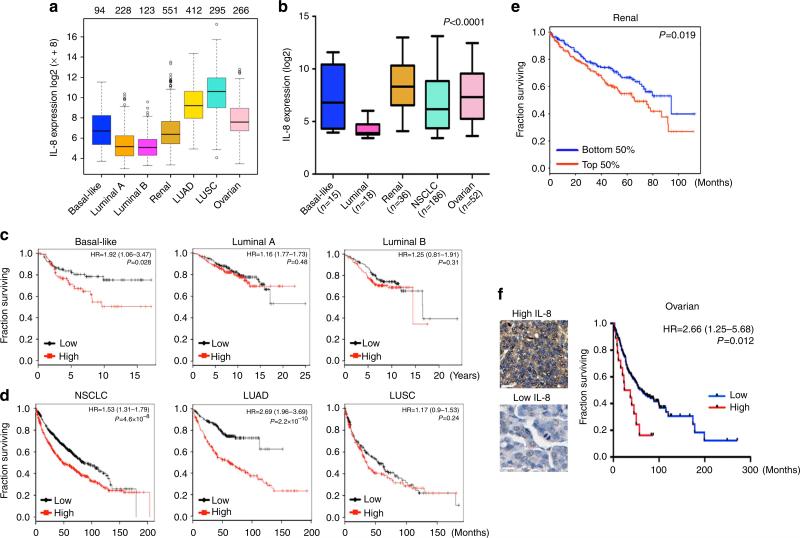
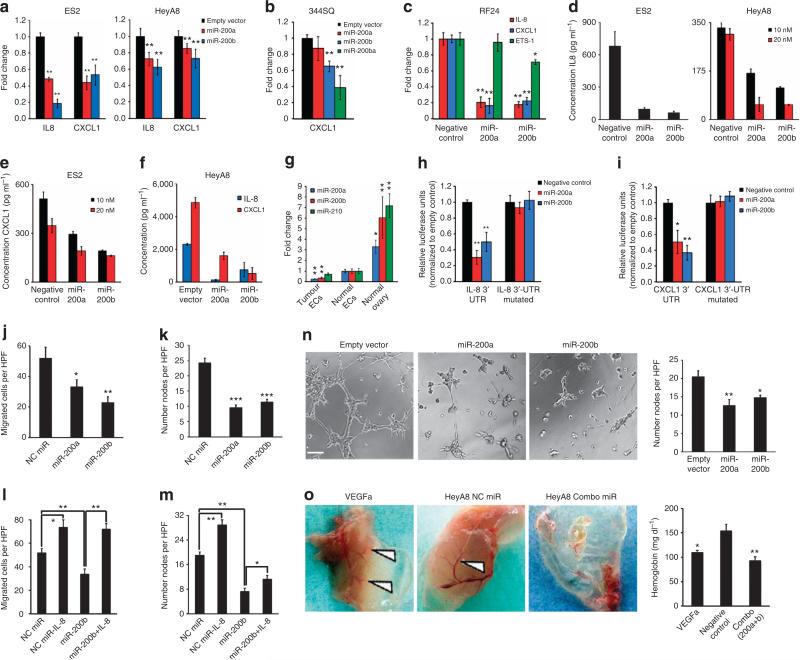
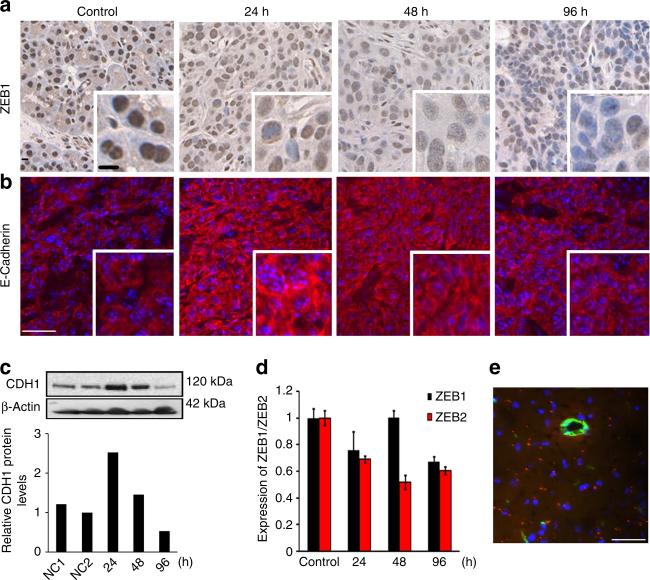
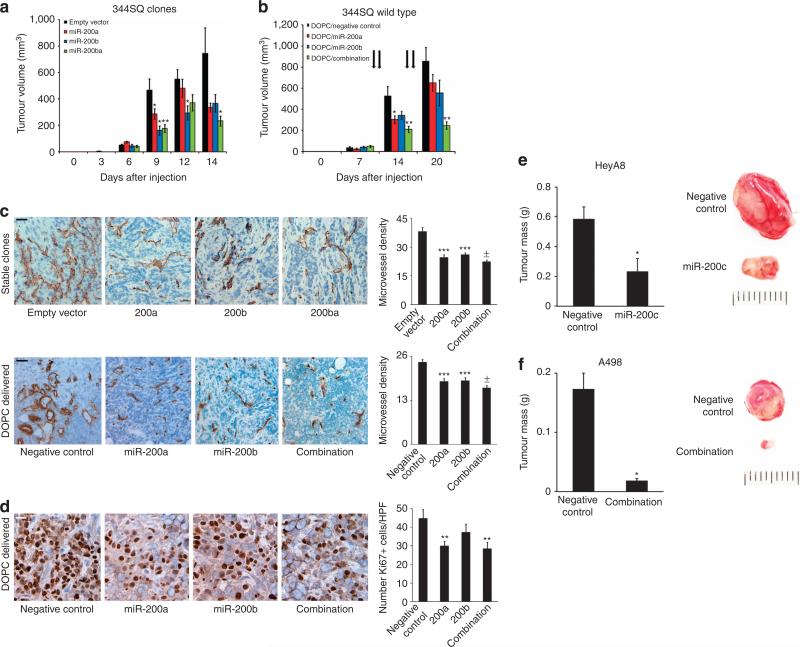
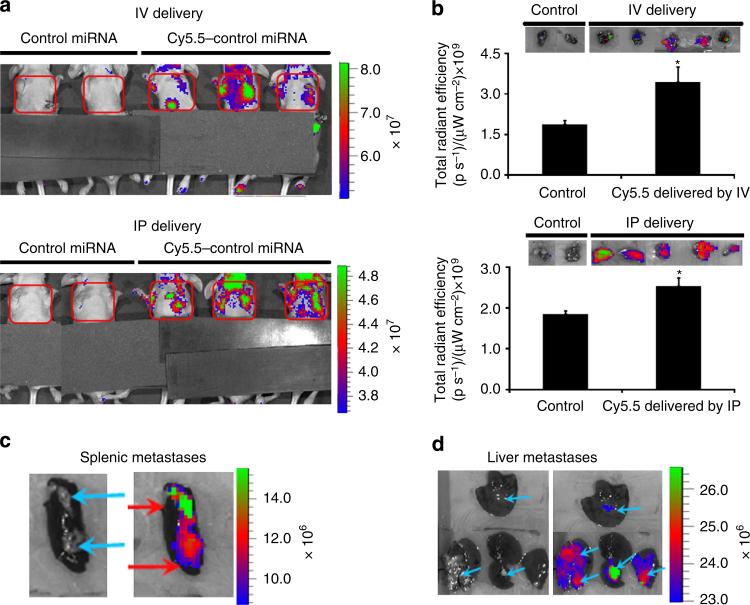
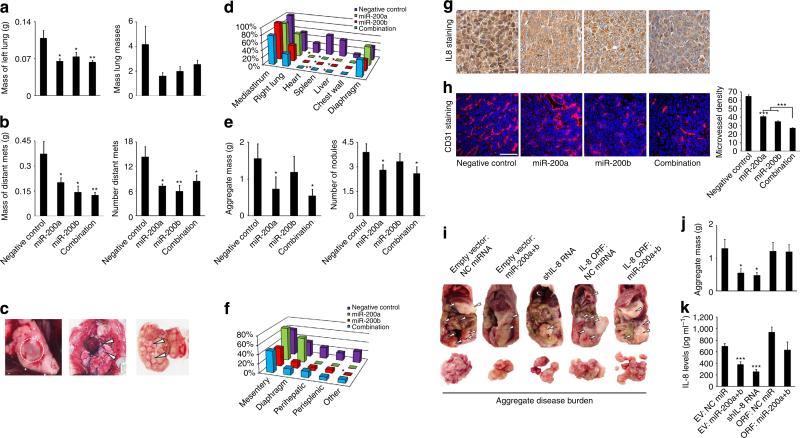
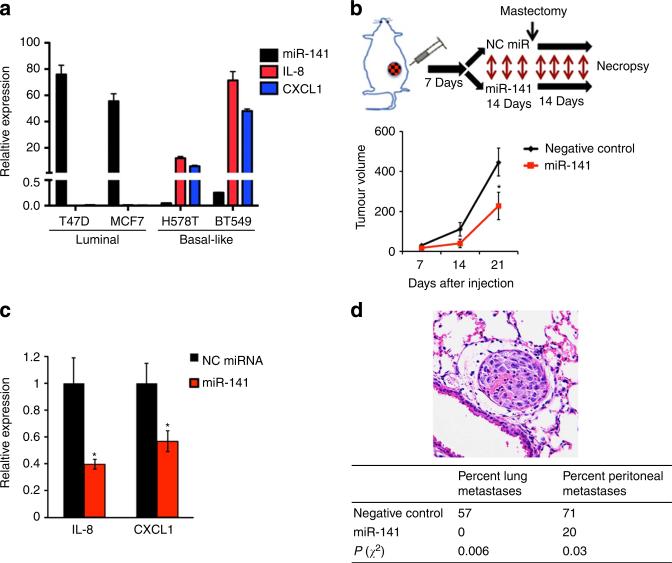
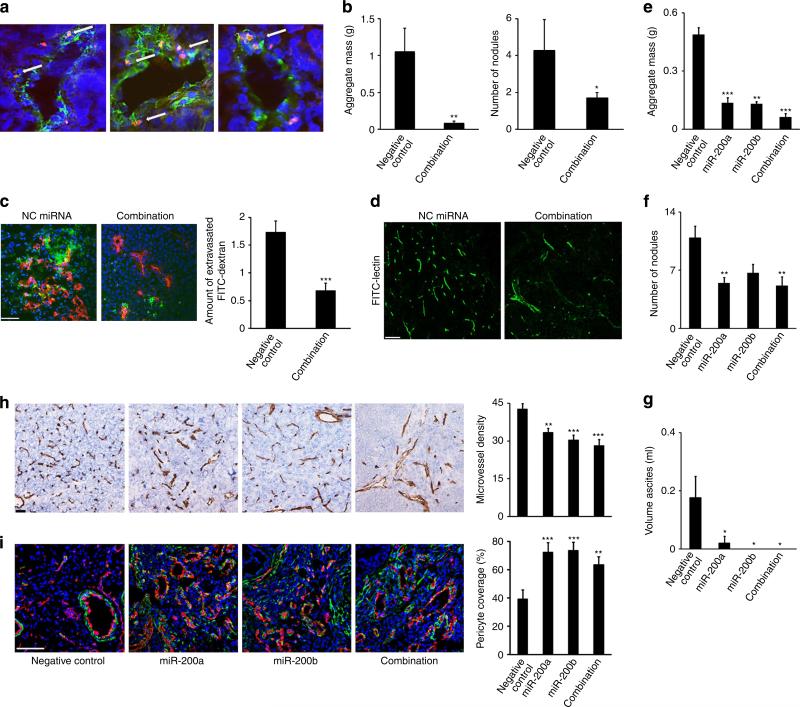
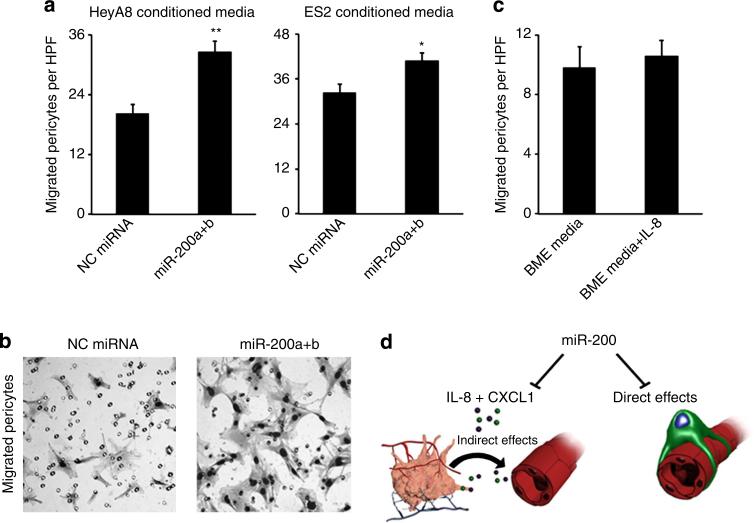
The miR-200 family is well known to inhibit the epithelial-mesenchymal transition, suggesting it may therapeutically inhibit metastatic biology. However, conflicting reports regarding the role of miR-200 in suppressing or promoting metastasis in different cancer types have left unanswered questions. Here we demonstrate a difference in clinical outcome based on miR-200's role in blocking tumour angiogenesis. We demonstrate that miR-200 inhibits angiogenesis through direct and indirect mechanisms by targeting interleukin-8 and CXCL1 secreted by the tumour endothelial and cancer cells. Using several experimental models, we demonstrate the therapeutic potential of miR-200 delivery in ovarian, lung, renal and basal-like breast cancers by inhibiting angiogenesis. Delivery of miR-200 members into the tumour endothelium resulted in marked reductions in metastasis and angiogenesis, and induced vascular normalization. The role of miR-200 in blocking cancer angiogenesis in a cancer-dependent context defines its utility as a potential therapeutic agent.


Figures

Figure 1
Figure 1. Divergent clinical outcomes and network regulation by the miR-200 family
Kaplan–Meier curves for overall survival for high and low expression of miR-200c in ovarian cancer, miR-200a in renal cancer and miR-141 in breast cancer (a). (Blue, low expression; red, high expression.) (b) miR-200b expression levels (in-situ hybridization) in non-small cell lung cancer (NSCLC). (Top) Representative images of high, medium and low expression, and (bottom) Kaplan–Meier curves for overall survival for high and low expression in all lung samples (left, n = 121), adenocarcinomas (middle, n = 69) and squamous cell carcinomas (right, n = 52). Scale bars, 250 μm. (c) Student's t-test comparison of the expression levels of epithelial and mesenchymal markers in breast, ovarian and renal samples above and below the median miR-200 expression levels. (Green, increased expression; red, decreased expression; non-filled dots, not significant; half-filled dots, P < 0.05; filled dots, P < 0.01, Student's t-test.) Kaplan–Meier curves for overall survival based on miR-200c expression (in-situ hybridization, representative high and low expression are shown) in serous ovarian carcinoma (n = 160) (d) and basal-like breast cancers (n = 103) (e). Kaplan–Meier curves for (f) microvessel density (left) in ovarian cancer. Pearson's correlation for miR-200c and (f) microvessel density (right). Scale bars, 250 μm (b–e). (g) Pearson's correlations for microarray expression levels from the NCI-60 cell line panel for IL-8 versus miR-200c. (h) Spearman's correlation of miR-200c and IL-8 expression levels of a 27 cell line panel.
Figure 2
Figure 2. Expression and clinical relevance of IL-8 cytokine expression
(a) Relative expression levels of IL-8 using RNA-Seq data from the TCGA data sets. The numbers above each tumour type (top of panel) represent the sample size used to calculate expression levels. LUAD, lung adenocarcinoma; LUSC, lung squamous carcinoma. Box plot represents first (lower bound) and third (upper bound) quartiles, whiskers represent 1.5 times the interquartile range. (b) Relative expression levels of IL-8 from the cancer cell line encyclopedia (CCLE) data set partitioned by designated tumour type. Analysis of variance test was used to test for statistical significance. NSCLC, non-small cell lung cancer. (c) Kaplan–Meier plots for overall survival based on IL-8 expression were generated for patients with basal-like (n = 185), luminal A (n = 459) and luminal B (n = 308) breast cancers. (d) Kaplan–Meier plots for overall survival based on IL-8 expression for patients with NSCLC (n = 1,404), lung adenocarcinoma (n = 486) and LUSC (n = 421). For c and d, above (high, in red) and below (low, in black) the median expression level was used as the threshold in all cohorts. (e) Kaplan–Meier plots for overall survival based on IL-8 expression for patients with renal adenocarcinomas (n = 469) from the CGA data set. Above (high, in red) and below (low, in blue) the median expression level was used as the threshold. (f) Kaplan–Meier plot for overall survival based on IL-8 protein expression for patients with ovarian cancer (n = 150). Scale bars, 200 μm.
Figure 3
Figure 3. Direct and indirect anti-angiogenic effects by miR-200
(a) Expression levels of IL-8 and CXCL1 for ES2 and HeyA8 clones, n = 3. Data are averages ± s.e.m. (b) Expression levels of CXCL1 from murine lung cancer (344SQ) clones, n = 3. Data are averages ± s.e.m. (c) Expression levels of IL-8, CXCL1 and Ets-1 following transfection of RF24 cells. Data are averages ± s.e.m., n = 3. (d) ELISA for IL-8 (ES2 and HeyA8) and (e) CXCL1 (ES2) following transfection. Data are averages ± s.e.m., n = 3. (f) ELISA for IL-8 and CXCL1 supernatants from HeyA8 clones. Data are averages ± s.e.m., n = 3. (g) Relative expression levels of miR-200a, miR-200b and miR-210 in clinically isolated endothelial cells from normal ovary (n = 2) versus carcinoma (n = 6). Further comparison with normal ovarian epithelium (n = 2) is shown. Data are averages ± s.e.m. P-values obtained with Mann–Whitney's t-test. (h) Relative luciferase activity normalized to empty control for the IL-8 3′-untranslated region (UTR) (wild-type, left; mutated, right). Data are averages ± s.e.m. P-values obtained with Student's t-test, n = 6. (i) Relative luciferase activity normalized to empty control for the CXCL1 3′-UTR (wild-type, left; mutated, right). Data are averages ± s.e.m. P-values obtained with Student's t-test, n = 6. (j) Direct effects on migration, n = 4 and (k) tube formation, n = 6 following RF24 transfection. Data are averages ± s.e.m. P-values were with Student's t-test. (l) Effects of exogenous recombinant IL-8 (10 ng ml−1) on migration and (m) tube formation following RF24 transfection, n = 6. Data are averages ± s.e.m. P-values were with Student's t-test. (n) Indirect effects on RF24 tube formation following incubation with HeyA8 supernatants, n = 6. Data are averages ± s.e.m. P-values were obtained with Student's t-test. Scale bar, 500 μm. (o) Representative images (left) and haemoglobin quantification (right) of an in-vivo matrigel plug assay, n = 2. White arrows demonstrate new blood vessel formation. Data are averages ± s.e.m. P-values obtained with Student's t-test. *P < 0.05, **P < 0.01, ***P < 1 × 10⁻⁹.
Figure 4
Figure 4. Effective target modulation with systemic miR-200 delivery
(a) Compared with an untreated 344SQ tumour, ZEB1 immunohistochemistry and (b) E-Cadherin immunofluorescent staining intensities following systemic miR-200b delivery. (c) Immunoblotting of tumour lystates for E-Cadherin (CDH1). (d) Relative tumour ZEB1 and ZEB2 expression levels following delivery. Data are averages ± s.e.m., n = 3. (e) Deep tumour delivery of Quasar 570-labelled (red) control miRNA in DOPC beyond the vasculature (CD31 staining—green, nuclear staining with Hoechst 33342—blue). Similar to a prior report, ~80% of the fields had nanoparticle delivery, and within each field 35% of tumour cells contained signal. Scale bars, 100 μm (a + e); 50 μm (b).
Figure 5
Figure 5. Effects of miR-200 delivery on angiogenesis in several cancer types
(a) Tumour volumes in a lung cancer model of 344SQ clones, n = 10 per group (no treatment), and (b) 344SQ wild-type cells (treated with systemic miRNAs incorporated into DOPC), n = 10 per group. Data are averages ±s.e.m. P-values obtained with Student's t-test. (c) CD31 staining and microvessel density scoring for (top) stable clones or (bottom) wild-type 344SQ tumours following miRNA delivery. Bar graphs represent number of microvessels per high-powered field (hpf), n = 5 tumours per group. Scale bars, 500 μm. Data are averages ± s.e.m. P-values obtained with Student's t-test. (d) Ki-67 staining for 344SQ tumours following miRNA delivery. Bar graphs represent number of Ki-67 staining cells per hpf, n = 5 tumours per group. Scale bar, 200 μm. Data are averages ± s.e.m. P-values obtained with Student's t-test. (e) Mass of HeyA8 ovarian tumours following treatment with either control miRNA or miR-200c, and (f) mass of A498 renal tumours following treatment with control miRNA or both miR-200a and miR-200b, n = 5 per group for each experiment. Data are averages ± s.e.m. Representative tumours are shown, scale in mm. *P < 0.05, **P < 0.01, ***P < 1 × 10⁻⁵, ±P < 1 × 10⁻⁸.
Figure 6
Figure 6. Nanoparticle delivery of oligonucleotides in a metastatic lung cancer model
Two weeks following injection with the 344SQ cell line, mice were treated with either DOPC/Cy5.5-labelled or DOPC/non-labelled oligonucleotides (200 μg kg−1 per mouse, 6 mice per group) by either intravenous (i.v.) or intraperitoneal (i.p.) routes. (a) Forty-eight hours after treatment, mice in each group were imaged adjacently before killing. Cy5.5-lablelled groups demonstrated enhanced uptake by either delivery route. (b) Excised primary lung tumours demonstrated increased uptake by measurement of total radiant efficiency (p s−1)/(μWcm−2). Gross metastatic lesions in the (c) spleen and in several (d) liver lesions demonstrated notable Cy5.5 uptake, suggesting DOPC-delivered oligonucleotides can target metastasis. Data are averages ± s.e.m., n = 6, P-values obtained with Student's t-test. *P < 0.001.
Figure 7
Figure 7. Therapeutic effects of miR-200 delivery in metastatic models
(a) Average mass of the left lung (left) and number of lung nodules (right) in the 344SQ lung cancer model. Data are averages ± s.e.m., n = 10. P-values obtained with Student's t-test. (b) Average aggregate mass of distant metastases (left) and number of distant metastases (right), n = 10 per group. Data are averages ± s.e.m. P-values were obtained with Student's t-test. (c) Representative images of an orthotopic left lung tumour (left, encircled), mediastinal (middle, arrows) and liver metastases (right, arrows). (d) Frequency of lung cancer metastases. P-values obtained with χ2-test. (e) Aggregate mass of distant metastases (left) and number of metastases (right) in the HeyA8 ovarian cancer model, n = 10 per group, Data are averages ± s.e.m. (f) Frequency of metastases to distant sites. Other: the pelvis, ovary, kidney or liver. (g) Representative tumour staining of IL-8 in the HeyA8 model. Scale bar, 200 μm. (h) Microvessel density for HeyA8 tumours following miRNA delivery, n = 5 tumours per group. Data are averages ± s.e.m. P-values obtained with Student's t-test. Scale bar, 200 μm. (i) Representative images of gross in vivo (top, white arrows) and aggregate ex vivo (bottom) metastatic tumour burden in the HeyA8 ovarian model at the time of necropsy. (j) Aggregate mass of metastasis (n = 10 mice per group) and (k) IL-8 plasma levels (n = 5 per group) in the HeyA8 model. Data are averages ± s.e.m. P-values obtained with Student's t-test. *P < 0.05, **P < 0.01, ***P < 1 × 10±4, ± P < 1 × 10⁻⁶.
Figure 8
Figure 8. Therapeutic effects of miR-200 in a basal-like breast cancer model
(a) Relative expression levels of miR-141, IL-8 and CXCL1 in breast cell lines. Data are averages ± s.e.m., n = 3. (b) Schematic of basal-like experiment (top) and primary tumour volumes (bottom) following systemic miRNA delivery. Data are averages ± s.e.m., n = 10. P-values obtained with Student's t-test. (c) Relative expression level of IL-8 and CXCL1 in resected primary tumours (n = 4) from each treatment group. (d) Haematoxylin and eosin image of lung micrometastasis (top) and frequencies of peritoneal and microscopic lung metastases (bottom). P-values obtained with the χ2-test. *P < 0.05.
Figure 9
Figure 9. Direct angiogenesis targeting and vascular normalization by endothelial miR-200 delivery
(a) Intra-endothelial and peri-endothelial miRNA localization (arrows) in HeyA8 tumours. Vessels visualized with CD31 (green) staining, Cy3-miRNA signal (red) and nuclei visualized with Hoechst 33342 (blue). Scale bar, 100 mm. (b) Average aggregate mass of distant metastases (left) and number of metastases (right) in HeyA8 ovarian model, n = 10 per group. Data are averages ± s.e.m. P-values obtained with Student's t-test. (c) Representative images (left) of FITC-dextran (green), CD31 (red) and nuclei visualized with Hoechst 33342 (blue) in HeyA8 tumours following three serial deliverys of miRNAs (n = 3 mice per group). Scale bar, 100 μm. Bar graphs (right) show a quantitative analysis of extravascular FITC-dextran. Data are averages ± s.e.m. (d) Representative confocal images of tumour vessels labelled with FITC-lectin in HeyA8 tumours following three serial deliverys of miRNAs (n = 2 mice per group). Scale bar, 50 μm. (e) Average aggregate mass of distant metastases and (f) number of metastases for the A2774 ovarian cancer model, n = 10 per group. Data are averages ± s.e.m. P-values obtained with Student's t-test. (g) Average volume of peritoneal ascites in the A2774 model, measured in ml. (h) Representative CD31 staining and microvessel density scoring for A2774 tumours following miRNA delivery. Bar graphs represent number of microvessels per hpf, n = 5 tumours per group. Scale bar, 500 μm. (i) Images of dual desmin and CD31 staining and percentage of pericyte coverage for A2774 tumours following miRNA delivery. Bar graphs represent the percentage of pericyte-covered microvessels per hpf, n = 5 tumours per group. Scale bar, 100 μm. Data are averages ± s.e.m. *P ≤ 0.05, **P < 0.01, ***P < 0.001.
Figure 10
Figure 10. Migration of pericyte-like cells using conditioned media of miR-200-transfected cells
(a) Migration of 10T1/2 pericyte-like cells at 6 h using conditioned media from HeyA8 (left) and ES2 (right) cells following miRNA transfection as a chemo-attractant. Data are averages ± s.e.m., n = 2. P-values obtained with Student's t-test. (b) Migration of 10T1/2 cells using complete media or complete media plus 10 ng ml−1 of IL-8 as a chemo-attractant. Data are averages ± s.e.m., n = 2. P-values obtained with Student's t-test. (c) Representative images of migrated pericyte-like cells using conditioned media from HeyA8 cells. (d) A model for miR-200 targeting of direct and indirect effects on angiogenesis. *P < 0.05, **P < 0.001.

References

    1. Korpal M, Lee ES, Hu G, Kang Y. The miR-200 family inhibits epithelial-mesenchymal transition and cancer cell migration by direct targeting of E-cadherin transcriptional repressors ZEB1 and ZEB2. J. Biol. Chem. 2008;283:14910–14914. - PMC - PubMed
    1. Park SM, Gaur AB, Lengyel E, Peter ME. The miR-200 family determines the epithelial phenotype of cancer cells by targeting the E-cadherin repressors ZEB1 and ZEB2. Genes Dev. 2008;22:894–907. - PMC - PubMed
    1. Gregory PA, et al. The miR-200 family and miR-205 regulate epithelial to mesenchymal transition by targeting ZEB1 and SIP1. Nat. Cell Biol. 2008;10:593–601. - PubMed
    1. Korpal M, et al. Direct targeting of Sec23a by miR-200s influences cancer cell secretome and promotes metastatic colonization. Nat. Med. 2011;17:1101–1108. - PMC - PubMed
    1. Dykxhoorn DM, et al. miR-200 enhances mouse breast cancer cell colonization to form distant metastases. PLoS One. 2009;4:e7181. - PMC - PubMed

Publication types

MeSH terms