. 2013 Nov;33(22):4395-407.
doi: 10.1128/MCB.00553-13. Epub 2013 Sep 9.

Major histocompatibility complex class I core promoter elements are not essential for transcription in vivo

Affiliations

Major histocompatibility complex class I core promoter elements are not essential for transcription in vivo

Zohar S Barbash et al. Mol Cell Biol. 2013 Nov.

Abstract

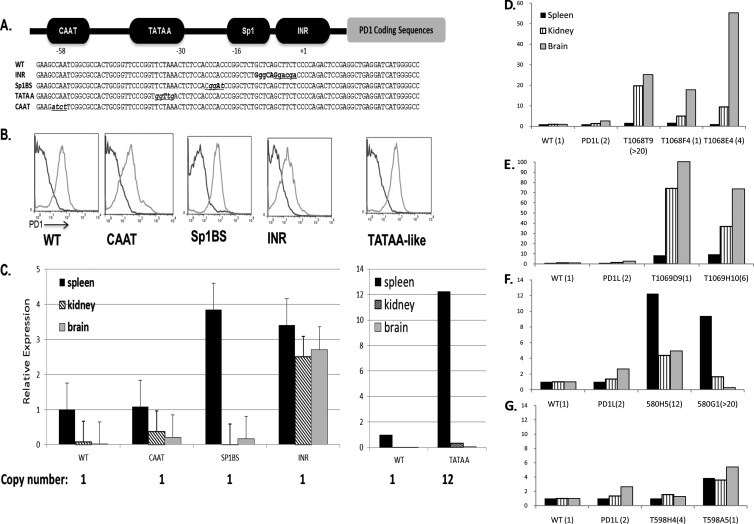
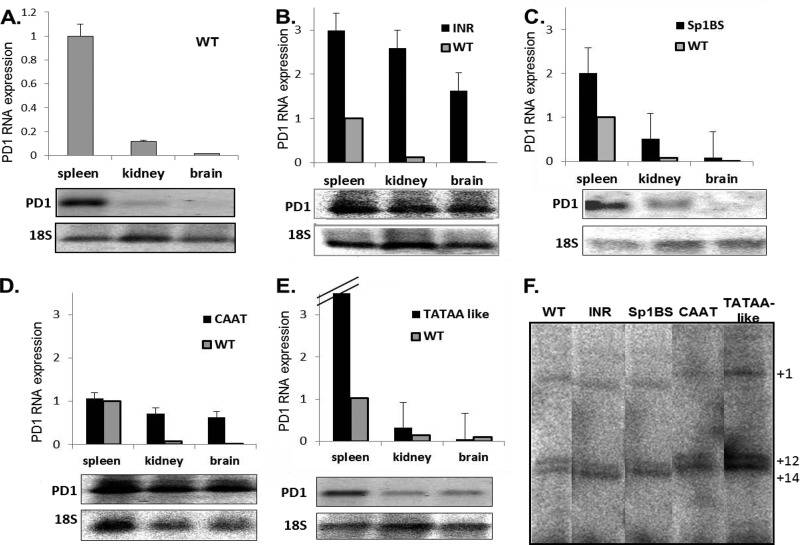
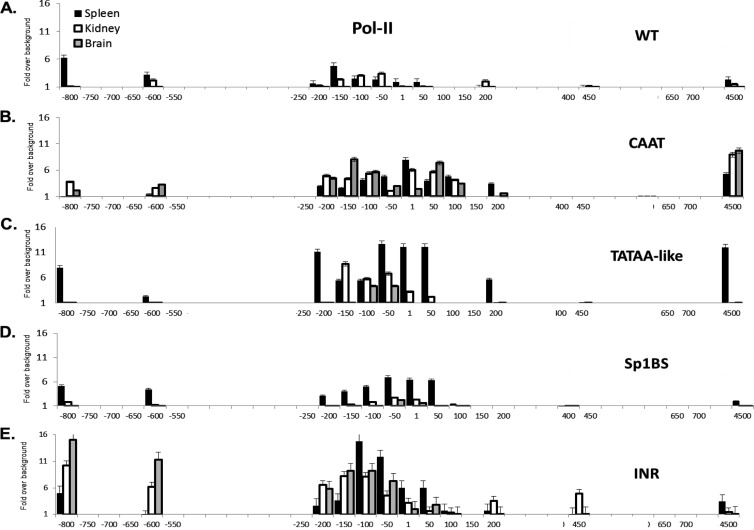
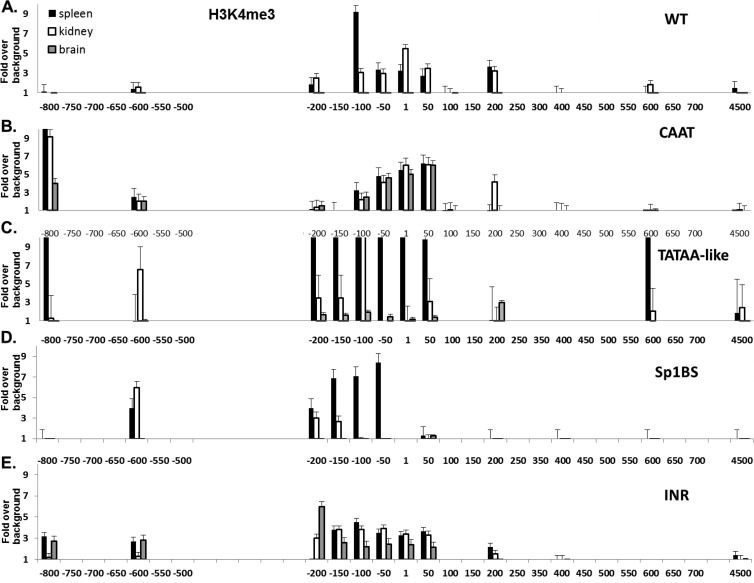
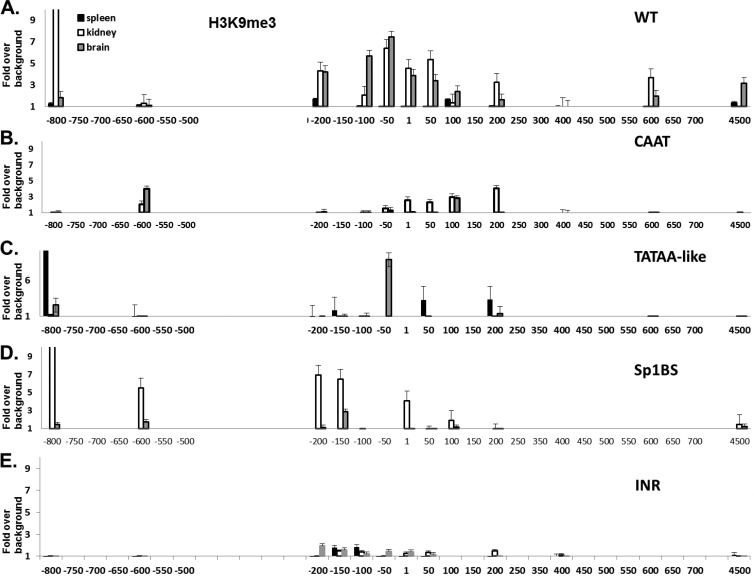
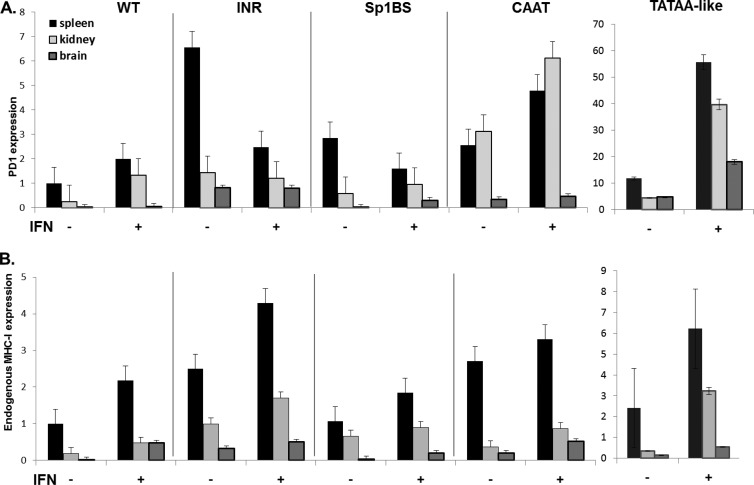
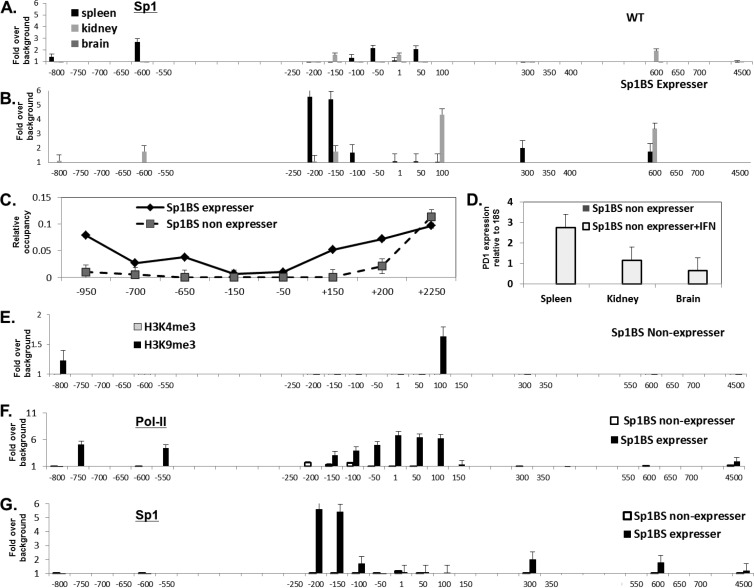
The role of core promoter elements in regulating transcription initiation is largely unknown for genes subject to complex regulation. Major histocompatibility complex class I genes are ubiquitously expressed and governed by tissue-specific and hormonal signals. Transcription initiates at multiple sites within the core promoter, which contains elements homologous to the canonical elements CCAAT, TATAA, Sp1 binding site (Sp1BS), and Initiator (Inr). To determine their functions, expression of class I transgenes with individually mutated elements was assessed. Surprisingly, all mutant promoters supported transcription. However, each mutated core promoter element had a distinct effect on expression: CAAT box mutations modulated constitutive expression in nonlymphoid tissues, whereas TATAA-like element mutations dysregulated transcription in lymphoid tissues. Inr mutations aberrantly elevated expression. Sp1BS element mutations resulted in variegated transgene expression. RNA polymerase II binding and histone H3K4me3 patterns correlated with transgene expression; H3K9me3 marks partially correlated. Whereas the wild-type, TATAA-like, and CAAT mutant promoters were activated by gamma interferon, the Sp1 and Inr mutants were repressed, implicating these elements in regulation of hormonal responses. These results lead to the surprising conclusion that no single element is required for promoter activity. Rather, each plays a distinct role in promoter activity, chromatin structure, tissue-specific expression, and extracellular signaling.


Figures

Fig 1
Fig 1
Core promoter elements contribute to tissue-specific expression regulation. (A) Diagrammatic representation of the PD1 core promoter upstream of PD1 coding sequences and sequences of the wild-type (WT) core promoter and core promoter element mutations that were used in the study. (B) Representative fluorescence-activated cell sorter profiles of PBL from individual WT and mutant promoter transgenic mice from separate founder lines (light gray curves). Dark gray curves represent staining of negative-control C57/BL6 mice with the relevant antibody. Profiles are representative of the majority of mice of each of the transgenic lines. (C) Real-time PCR analysis of PD1 RNA levels in tissues of the different core promoter mutant transgenic mice relative to the WT. The CAAT mutant (T1068F4), Sp1BS mutant (T598A5), Inr mutant (T1069D9), and TATAA-like mutant (T580H5) are also shown. At least 3 mice from each founder line were analyzed individually (data are averages ± standard deviations [SD]). Transgene copy number for strains analyzed are listed. (D to G) PD1 RNA levels in spleen, kidney, and brain were determined in independently derived lines of CCAAT mutants (D), Inr mutants (E), TATAA-like mutants (F), and Sp1BS mutants (G) and compared to the WT and to published data from a second transgenic line, PD1L, that has a wild-type promoter (34). Numbers in parentheses next to the transgene name indicate transgene copy number. Note that in each tissue, the data are expressed relative to the wild-type level in that tissue.
Fig 2
Fig 2
Core promoter elements affect tissue-specific expression. The graphs represent qPCR averages of expressing strains for each mutant. The Northern blot analyses of PD1 RNA levels in tissues of the different core promoter mutant transgenic mice are representative. The WT (A), Inr mutants (T1069D9 and T1069H10) (B), Sp1BS mutants (T598A5 and T598H4) (C), CAAT mutants (T1068E4, T1068F4, and T1068T9) (D), and TATAA-like mutants (T580G1 and T580H5) (E) are shown. Experiments were repeated 3 times with at least 3 mice from each core promoter mutant transgenic line. (F) RNA primer extension analysis of in vivo TSS in spleen from WT and promoter mutant transgenic mice: Inr mutant (T1069D9), Sp1BS mutant (T598A5), CAAT mutant (T1068F4), and TATAA-like mutant (T580H5). The numbers on the right indicate base pairs relative to the TSS at +1. All of the samples were run on the same gel but were cropped for illustration purposes. This gel is representative of 3 experiments.
Fig 3
Fig 3
Pol II occupancy correlates with activity of mutant core promoters. Pol II ChIP analysis of spleen, kidney, and brain from the WT and core promoter mutant strains. WT (A), CAAT (B), TATAA-like (C), Sp1BS (D), and Inr (E) core promoter mutant transgenic strains are shown. Note that the x axis denotes location relative to the TSS and is not to scale. ChIP was performed as described in Materials and Methods. Experiments were repeated three times with 3 mice from each core promoter mutant transgenic line. The strains that were used are detailed in Materials and Methods.
Fig 4
Fig 4
Chromatin histone modification H3K4me3 correlates with activity of mutant core promoters. H3K4me3 ChIP analysis of spleen, kidney, and brain from the WT and core promoter mutant strains. ChIP was performed as described in Materials and Methods. WT (A), CAAT (B), TATAA-like (C), Sp1BS (D), and Inr (E) core promoter mutant transgenic strains are shown. Note that the x axis denotes location relative to the TSS and is not to scale. Experiments were repeated three times with 3 mice from each core promoter mutant transgenic line. The strains that were used are detailed in Materials and Methods.
Fig 5
Fig 5
Chromatin histone modification H3K9me3 correlates with activity of WT as well as with CAAT and Inr, but not with TATAA-like and Sp1BS, mutant core promoters. H3K9me3 ChIP analysis of spleen, kidney, and brain from the WT and core promoter mutant strains. ChIP was performed as described in Materials and Methods. WT (A), CAAT (B), TATAA-like (C), Sp1BS (D), and Inr (E) core promoter mutant transgenic strains are shown. Note that the x axis denotes location relative to the TSS and is not to scale. Experiments were repeated 3 times with 3 mice from each core promoter mutant transgenic line. The strains that were used are detailed in Materials and Methods.
Fig 6
Fig 6
Core promoter element mutants Sp1BS and Inr modulate the IFN-γ response. Transgenic mice were treated with IFN-γ as described in Materials and Methods. RNA from spleen, kidney, and brain was extracted and subjected to real-time PCR. (A) Real-time PCRs were performed using a specific exon 2 to 3 junction primer set of the PD1 gene. (B) Real-time PCRs using primers specific for the endogenous mouse MHC class I H2-Kb gene in the tissues of the same mice. All real-time PCRs are relative to an 18S standard. A summary of the P value calculations for the significance of IFN-γ induction is provided in Table 3 at DinahSingerLab.cancer.gov. The strains that were used are detailed in Materials and Methods.
Fig 7
Fig 7
Sp1BS mutant transgene constitutive nonexpresser binds Sp1 anomalously and is induced to express by IFN-γ treatment. (A and B) ChIP analyses with anti-Sp1-specific antibody on tissues from WT (A) and Sp1BS expresser mice (T598A5) (B). (C) The relative nucleosome occupancy across the PD1 gene in the spleens of expresser and nonexpresser Sp1BS mutant transgenic mice (T598A5 and T598J5, respectively) was determined as described in Materials and Methods. (D) SP1BS nonexpresser (T598J5) mice were treated with IFN-γ or mock treated as described in Materials and Methods; the levels of PD1 RNA in spleen, kidney, and brain were measured by real-time quantitative PCR. (E) ChIP assays for H3K4me3 and H3K9me3 were performed on chromatin extracted from spleens of Sp1BS nonexpresser (T598J5) mice; compare to data for the Sp1BS expresser shown in in Fig. 4 and 5. (F) ChIP for Pol II was performed on chromatin extracted from spleens of Sp1BS expresser and nonexpresser (T598A5 and T598J5, respectively) mice. (G) ChIP for Sp1 antibody was performed on chromatin extracted from spleens of Sp1BS expresser and nonexpresser (T598A5 and T598J5, respectively) mice. ChIP was performed as described in Materials and Methods. In panels A to C and E to G, the x axis denotes location relative to the TSS and is not to scale.

Similar articles

Cited by

References

    1. Berk AJ. 1999. Activation of RNA polymerase II transcription. Curr. Opin. Cell Biol. 11:330–335 - PubMed
    1. Roeder RG. 1996. The role of general initiation factors in transcription by RNA polymerase II. Trends Biochem. Sci. 21:327–335 - PubMed
    1. Chen JL, Attardi LD, Verrijzer CP, Yokomori K, Tjian R. 1994. Assembly of recombinant TFIID reveals differential coactivator requirements for distinct transcriptional activators. Cell 79:93–105 - PubMed
    1. Gill G. 2001. Regulation of the initiation of eukaryotic transcription. Essays Biochem. 37:33–43 - PubMed
    1. Kadonaga JT. 2004. Regulation of RNA polymerase II transcription by sequence-specific DNA binding factors. Cell 116:247–257 - PubMed

Publication types

LinkOut - more resources