. 2013 Dec;12(12):3690-703.
doi: 10.1074/mcp.M113.031013. Epub 2013 Sep 9.

Proteomic and virus-induced gene silencing (VIGS) Analyses reveal that gossypol, brassinosteroids, and jasmonic acid contribute to the resistance of cotton to Verticillium dahliae

Affiliations

Proteomic and virus-induced gene silencing (VIGS) Analyses reveal that gossypol, brassinosteroids, and jasmonic acid contribute to the resistance of cotton to Verticillium dahliae

Wei Gao et al. Mol Cell Proteomics. 2013 Dec.

Abstract

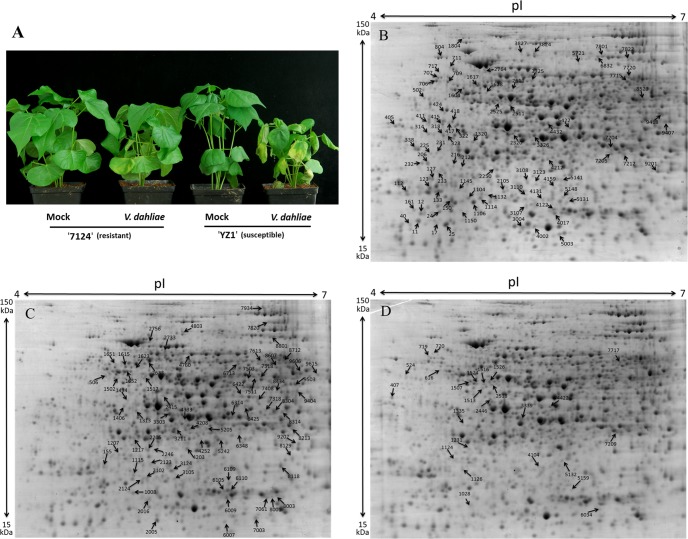
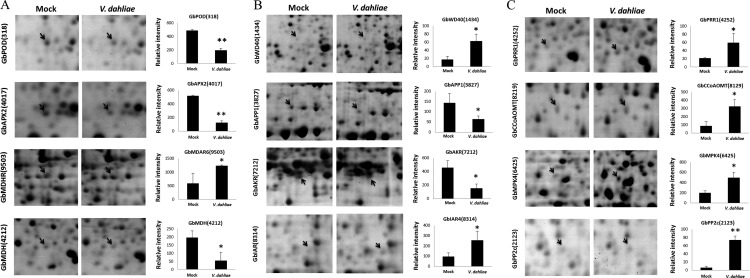
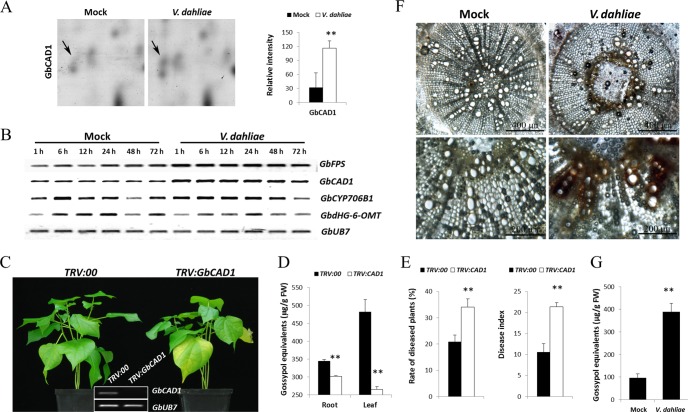
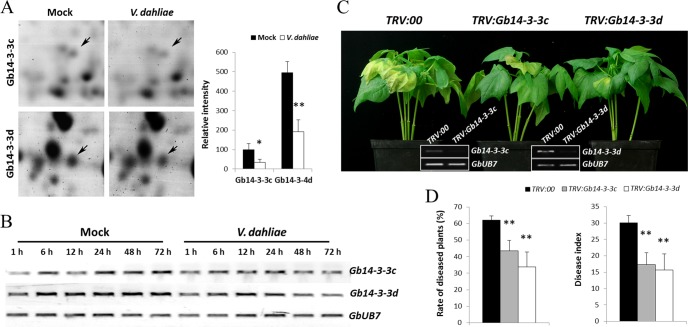
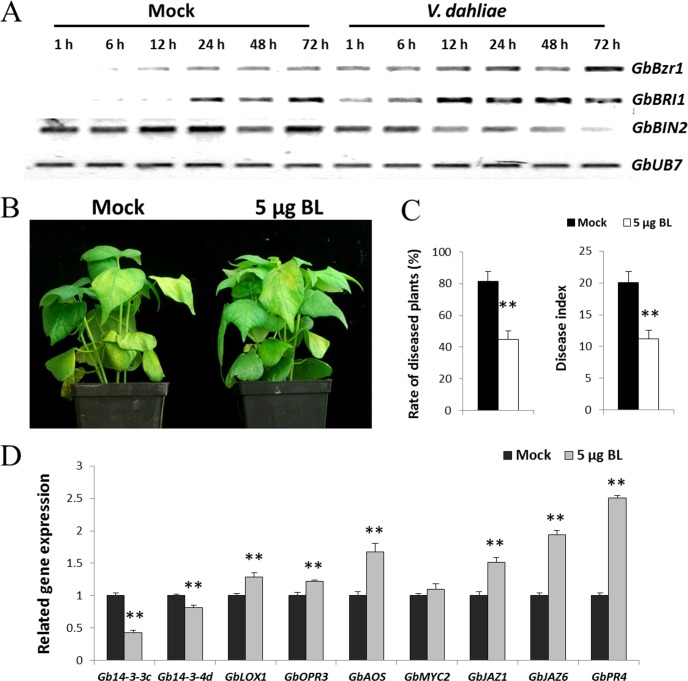
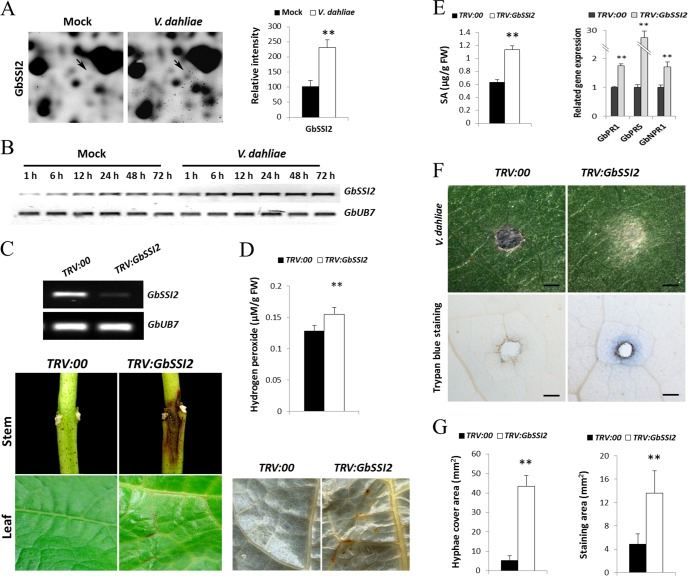
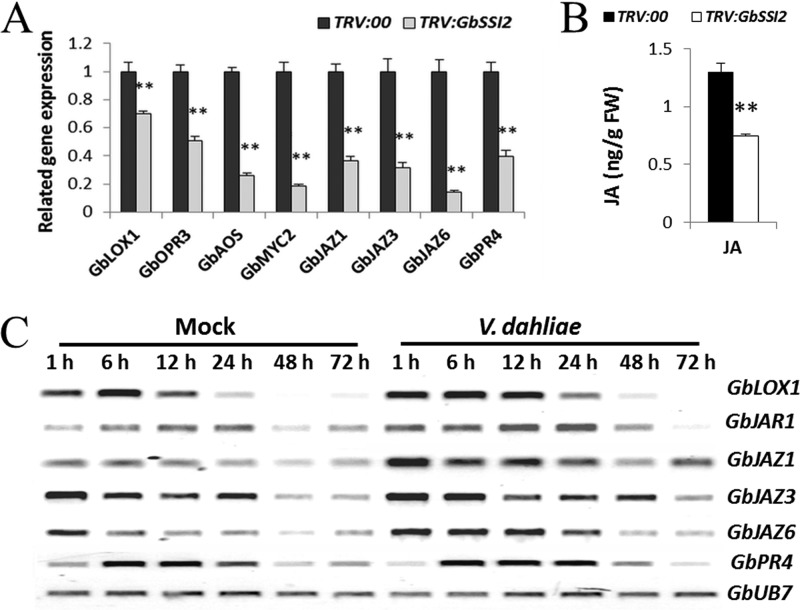
Verticillium wilt causes massive annual losses of cotton yield, but the mechanism of cotton resistance to Verticillium dahliae is complex and poorly understood. In this study, a comparative proteomic analysis was performed in resistant cotton (Gossypium barbadense cv7124) on infection with V. dahliae. A total of 188 differentially expressed proteins were identified by mass spectrometry (MALDI-TOF/TOF) analysis and could be classified into 17 biological processes based on Gene Ontology annotation. Most of these proteins were implicated in stimulus response, cellular processes and metabolic processes. Based on the proteomic analysis, several genes involved in secondary metabolism, reactive oxygen burst and phytohormone signaling pathways were identified for further physiological and molecular analysis. The roles of the corresponding genes were further characterized by employing virus-induced gene silencing (VIGS). Based on the results, we suggest that the production of gossypol is sufficient to affect the cotton resistance to V. dahliae. Silencing of GbCAD1, a key enzyme involving in gossypol biosynthesis, compromised cotton resistance to V. dahliae. Reactive oxygen species and salicylic acid signaling may be also implicated as regulators in cotton responsive to V. dahliae according to the analysis of GbSSI2, an important regulator in the crosstalk between salicylic acid and jasmonic acid signal pathways. Moreover, brassinosteroids and jasmonic acid signaling may play essential roles in the cotton disease resistance to V. dahliae. The brassinosteroids signaling was activated in cotton on inoculation with V. dahliae and the disease resistance of cotton was enhanced after exogenous application of brassinolide. Meanwhile, jasmonic acid signaling was also activated in cotton after inoculation with V. dahliae and brassinolide application. These data provide highlights in the molecular basis of cotton resistance to V. dahliae.


Figures

Fig. 1.
Fig. 1.
Disease symptoms on two kinds of cotton cultivars and representative 2-DE maps of total differential expression proteins isolated from the resistant cotton cultivar. A, Infection of cotton seedlings with V. dahliae. After seeding for 2 weeks, the seedlings of G. barbadense cv7124 (resistant) and G. hirsutum cv.YZ-1 (susceptible) were dip-infected with the liquid containing V. dahliae spores and treated with sterile distilled water as a Mock treatment. At least 20 plants were used for V. dahliae inoculation per experiment and the experiment was repeated for three times at the same condition. The Mock and infected roots of 7124 harvested at 1, 6, 12, 24, 48, and 72 hpi were used for protein and RNA extraction. Photos were taken 14 d post inoculation. B, Protein spots of down-regulation, C, up-regulation and (D) other regulatory patterns are indicated in the representative 2-DE maps. The differently expressed proteins were labeled in the images.
Fig. 2.
Fig. 2.
Representative protein spots shown on 2-DE maps and quantification of the signal intensities. A, Oxidative burst-related proteins. GbPOD, peroxidase; GbAPX2, ascorbate peroxidase; GbMDAR6, monodehydro ascorbate reductase; GbMDH, malate dehydrogenase. B, Auxin signaling-related proteins. GbWD40, WD40 repeat-like superfamily protein; GbAPP1, amino peptidase P1; GbAKR, auxin-induced protein pcnt115; GbIAR4, pyruvate dehydrogenase E1a-like subunit. C, Other disease-related proteins. GbPRR1, phenylcoumaran benzylic ether reductase-like protein; GbCCoAOMT, caffeoyl-CoAO-methyltransferase; GbMAPK4, mitogen-activated protein kinase; GbPP2C, protein phosphatase 2c. Proteins with differential expression were shown in 2-DE maps and the signal intensities obtained from three independent 2-DE gels. Error bars represent the standard deviation of three biological replicates; asterisks indicate statistically significant differences, as determined by the Student t test (*p < 0.05; **p < 0.01).
Fig. 3.
Fig. 3.
Gossypol is involved in the resistance of cotton to V. dahliae. A, Shown are representative protein spot (GbCAD1) on inoculation with V. dahliae and quantification of the signal intensities obtained from three independent 2-DE maps. Error bars represent the standard deviation of three biological replicates; asterisks indicate statistically significant differences, as determined by the Student t test (**p < 0.01). B, RT-PCR analysis of gossypol biosynthesis-related genes at the transcriptional level in G. barbadense cv7124 on inoculation with V. dahliae. PCR was performed by 28 cycles of amplification for GbUB7 and 29 cycles for other genes. GbFPS, farnesyl diphosphate synthase; GbCYP706B1, cytochrome P450 mono-oxygenase. C, Disease symptoms induced on empty vector control (TRV:00) or GbCAD1-silenced (TRV:GbCAD1) cotton plants after inoculation with V. dahliae strain V991. Ten-day-old G. barbadense cv7124 seedlings were hand-infiltrated with Agrobacterium carrying individual genes in the VIGS vector. Two weeks after infiltration, the seedlings were dip-inoculated with V. dahliae. Photos were taken at 12 d after inoculation. D, Accumulation of sesquiterpene aldehydes (gossypol equivalents) of control (TRV:00) and GbCAD1-silenced (TRV:GbCAD1) cotton plants. The roots and leaves of control and GbCAD1-silenced cotton plants were collected for sesquiterpene aldehydes extraction and quantitation 12 d after VIGS-infiltration. Error bars represent the standard deviation of three replicates (n = 12); asterisks indicate statistically significant differences, as determined by the Student t test (**p < 0.01). E, Rate of diseased plants and disease index measurement of control (TRV:00) and GbCAD1-silenced (TRV:GbCAD1) cotton plants after inoculation with conidial suspension of V991. The rate of diseased plants and disease index were measured at 4 d after the plants beginning to present disease symptoms. Error bars represent the standard deviation of three biological replicates (n ≥ 16); asterisks indicate statistically significant differences, as determined by the Student t test (**p < 0.01). F, Detection of gossypol accumulation in cotton roots inoculated with V991. Radial sections of uninfected cotton roots display less orange-staining gossypol than infected cotton roots. Scale bars: 400 μm and 200 μm, respectively. G, Accumulation of sesquiterpene aldehydes (gossypol equivalents) of G. barbadense cv7124 inoculated with V991. After inoculation with V991 for 5 d, the Mock and infected roots of 7124 were harvested for sesquiterpene aldehydes extraction and quantitation. Error bars represent the standard deviation of three replicates (n = 12); asterisks indicate statistically significant differences, as determined by the Student t test (**p < 0.01).
Fig. 4.
Fig. 4.
Silencing of Gb14-3-3 enhances cotton resistance to V. dahliae. A. Shown are representative protein spots (Gb14-3-3c, Gb14-3-3d) on inoculation with V. dahliae and quantification of the signal intensities obtained from three independent 2-DE maps. Error bars represent the standard deviation of three biological replicates; asterisks indicate statistically significant differences, as determined by the Student t test (*p < 0.05; **p < 0.01). B, RT-PCR analysis of the expression pattern of Gb14-3-3c and Gb14-3-3d at the transcriptional level in G. barbadense cv.7124 on inoculation with V. dahliae. PCR was performed by 28 cycles of amplification for GbUB7 and 30 cycles for other genes. C, Disease symptoms induced on TRV:00, TRV:Gb14-3-3c or TRV:Gb14-3-3d cotton after inoculation with V. dahliae strain V991. Ten-day-old G. hirsutum cvYZ-1 seedlings were hand-infiltrated with Agrobacterium carrying individual genes in the VIGS vector. Two weeks after infiltration, the seedlings were dip-inoculated with V. dahliae. Photos were taken at 9 d after inoculation. D, Rate of diseased plants and disease index measurement of TRV:00, TRV:Gb14-3-3c and TRV:Gb14-3-3d cotton plants after inoculation with conidial suspension of V991 by root dipping method. The rate of diseased plants and disease index were measured at 4 d after the plants beginning to present disease symptoms. Error bars represent the standard deviation of three biological replicates (n ≥ 16); asterisks indicate statistically significant differences, as determined by the Student t test (**p < 0.01).
Fig. 5.
Fig. 5.
BL enhances disease resistance caused by V. dahliae in cotton. A, RT-PCR analysis of BR signaling pathway-related genes at the transcriptional level in G. barbadense cv7124 on inoculation with V. dahliae. PCR was performed by 28 cycles of amplification for GbUB7 and 29 cycles for other genes. BZR1, Brassinazole resistant 1; BRI1, Brassinosteroid insensitive 1; BIN2, Brassinosteroid insensitive 2. B, Effect of 5 μg/pot BL application on G. hirsutum cvYZ-1 seedlings inoculated with V. dahliae. Each experiment contains 16 plants and the experiment repeats for three times. Photograph of representative disease symptoms taken 9 d after inoculation. C, Rate of diseased plants and disease index of water- and BL-treated cotton plants. Plants were treated with BL by soil drenching 24 h before challenge inoculation with V. dahliae. The rate of diseased plants and disease index were measured at 4 d after the plants beginning to present disease symptoms. Error bars represent the standard deviation of three biological replicates (n ≥ 16); asterisks indicate statistically significant differences, as determined by the Student t test (**p < 0.01). D, qPCR analysis of the Gb14-3-3c and Gb14-3-3d transcripts in control and BL treatments. JA signaling-related genes were detected at the transcriptional levels by qPCR. Error bars represent the standard deviation for three independent experiments, and three technical replicates were analyzed; asterisks indicate statistically significant differences, as determined by the Student t test (*p < 0.05; **p < 0.01).
Fig. 6.
Fig. 6.
Activation of ROS and SA enhances the susceptibility of GbSSI2-silenced cotton to V. dahliae. A, Shown are representative protein spot (GbSSI2) on inoculation with V. dahliae and quantification of the signal intensities obtained from three independent 2-DE maps. Error bars represent the standard deviation of three biological replicates; asterisks indicate statistically significant differences, as determined by the Student t test (*p < 0.05; **p < 0.01). B, RT-PCR analysis of the expression pattern of GbSSI2 at the transcriptional level in G. barbadense cv7124 on inoculation with V. dahliae. PCR was performed by 28 cycles of amplification for GbUB7 and 30 cycles for GbSSI2. C, Spontaneous lesion formation on the stems and leaves of TRV:GbSSI2 plants. The cotyledons of 10-day-old seedlings of G. barbadense cv7124 were hand-infiltrated with Agrobacterium carrying either TRV:GbSSI2 or VIGS-vector control (TRV:00). Spontaneous lesion was present on the stems and leaves of GbSSI2-silenced plants 12 d after infiltration. RT-PCR analysis indicated that the transcripts of GbSSI2 were reduced 12 d after infiltration. D, DAB staining and measurement of H2O2 accumulation in TRV:00 and TRV:GbSSI2 leaves. Error bars represent the standard deviation of three replicates (n = 12); asterisks indicate statistically significant differences, as determined by the Student t test (**p < 0.01). E, Detection of SA signaling pathway-related genes and alteration of SA levels in TRV:00 and TRV:GbSSI2 plants. Error bars of qRT analysis represent the standard deviation for three independent experiments, and three technical replicates were analyzed; Error bars of SA levels represent the standard deviation of three biological replicates (n = 10); asterisks indicate statistically significant differences, as determined by the Student t test (**p < 0.01). F, Disease symptoms induced on the leaves of TRV:00 and TRV:GbSSI2 cotton plants 3 d after inoculation with spore suspension of V. dahliae (106 conidia per ml). Mycelia growth on leaves inoculated with V991 (Fig. 6F, upper panel). Trypan blue staining of V991-infected leaves (Fig. 6F, lower panel). Scale bars: 1 mm. G, Hyphae cover area and trypan blue staining area of V991-infected leaves. Error bars represent the standard deviation of three replicates (n = 12); asterisks indicate statistically significant differences, as determined by the Student t test (**p < 0.01).
Fig. 7.
Fig. 7.
The JA signaling pathway is suppressed in GbSSI2-silenced cotton and activated in cotton after inoculation with V. dahliae. A, Detection of JA signaling pathway-related genes in TRV:00 and TRV:GbSSI2 plants by qPCR. Error bars represent the standard deviation for three independent experiments, and three technical replicates were analyzed; asterisks indicate statistically significant differences, as determined by the Student t test (**p < 0.01). B, Detection of JA levels in TRV:00 and TRV:GbSSI2 plants. Error bars represent the standard deviation of three biological replicates (n = 10); asterisks indicate statistically significant differences, as determined by the Student t test (**p < 0.01). C, RT-PCR analysis of JA signaling pathway-related genes in G. barbadense cv7124 on inoculation with V. dahliae. PCR was performed by 28 cycles of amplification for GbUB7 and 29 cycles for other genes.

Similar articles

Cited by

References

    1. Sal'kova E. G., Guseva N. N. (1965) The role of pectolytic enzymes of the verticillium dahliae fungus in the development of cotton wilt. Dokl. Akad. Nauk SSSR 163, 515–522 - PubMed
    1. Cai Y. F., He X. H., Mo J. C., Sun Q., Yang J. P., Liu J. G. (2009) Molecular research and genetic engineering of resistance to Verticillium wilt in cotton: A review. Afr. J. Biotechnol. 8, 7363–7372
    1. Zhang J., Sanogo S., Flynn R., Baral J., Bajaj S., Hughs S. E., Percy R. (2012) Germplasm evaluation and transfer of Verticillium wilt resistance from Pima (Gossypium barbadense) to Upland cotton (G. hirsutum). Euphytica 187, 147–160
    1. Aguado A., Santos B. D. L., Blanco C., Romero F. (2008) Study of gene effects for cotton yield and Verticillium wilt tolerance in cotton plant (Gossypium hirsutum L.). Field Crops Res. 107, 78–86
    1. Jiang F., Zhao J., Zhou L., Guo W., Zhang T. (2009) Molecular mapping of Verticillium wilt resistance QTL clustered on chromosomes D7 and D9 in upland cotton. Sci. China C Life Sci. 52, 872–884 - PubMed

Publication types

MeSH terms