. 2014 Jan;44(1):195-203.
doi: 10.1002/eji.201343509. Epub 2013 Oct 1.

CD161++ CD8+ T cells, including the MAIT cell subset, are specifically activated by IL-12+IL-18 in a TCR-independent manner

Affiliations
Free PMC article

CD161++ CD8+ T cells, including the MAIT cell subset, are specifically activated by IL-12+IL-18 in a TCR-independent manner

James E Ussher et al. Eur J Immunol. 2014 Jan.
Free PMC article

Abstract

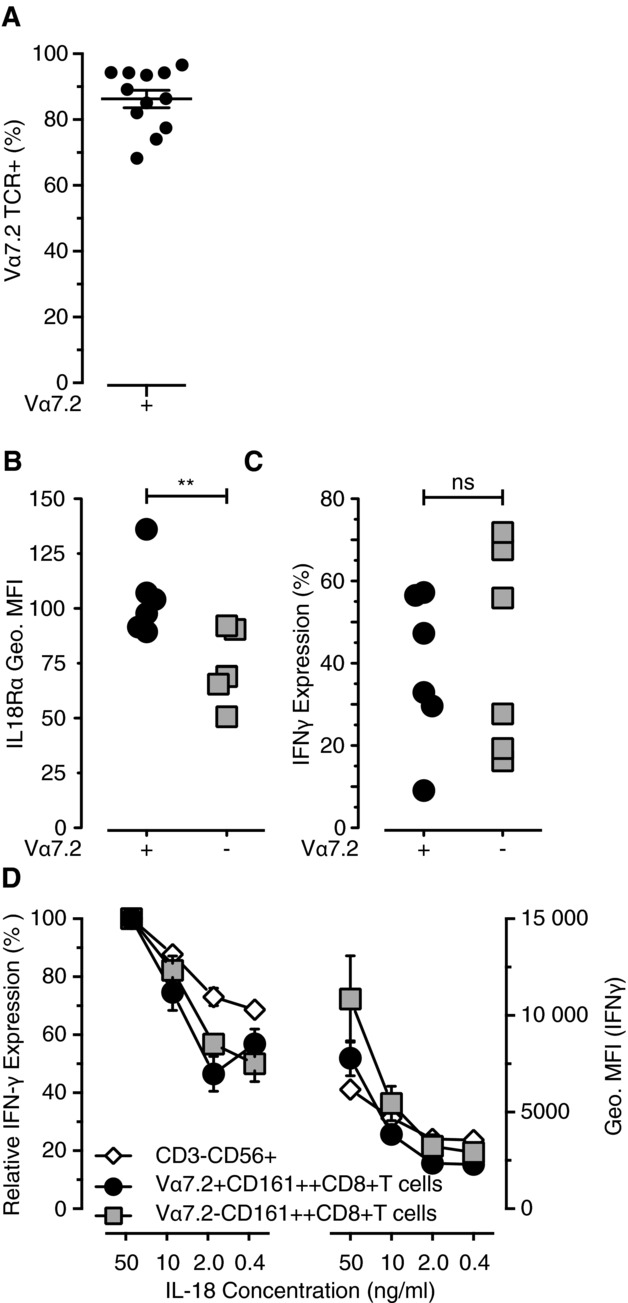
CD161(++) CD8(+) T cells represent a novel subset that is dominated in adult peripheral blood by mucosal-associated invariant T (MAIT) cells, as defined by the expression of a variable-α chain 7.2 (Vα7.2)-Jα33 TCR, and IL-18Rα. Stimulation with IL-18+IL-12 is known to induce IFN-γ by both NK cells and, to a more limited extent, T cells. Here, we show the CD161(++) CD8(+) T-cell population is the primary T-cell population triggered by this mechanism. Both CD161(++) Vα7.2(+) and CD161(++) Vα7.2(-) T-cell subsets responded to IL-12+IL-18 stimulation, demonstrating this response was not restricted to the MAIT cells, but to the CD161(++) phenotype. Bacteria and TLR agonists also indirectly triggered IFN-γ expression via IL-12 and IL-18. These data show that CD161(++) T cells are the predominant T-cell population that responds directly to IL-12+IL-18 stimulation. Furthermore, our findings broaden the potential role of MAIT cells beyond bacterial responsiveness to potentially include viral infections and other inflammatory stimuli.

Keywords: CD161++ T cells; IL-12; IL-18; MAIT cells; T cells.


Figures

Figure 1
Figure 1
Intra- and extracellular IL-18Rα expression on CD8+ T-cell subsets. (A) Representative flow cyto-metry plots of IL-18Rα expression are shown. (B) The geometric MFI of IL-18Rα expression for each subset is shown (n = 13). (C, D) IL-12+IL-18 specifically triggers CD161++CD8+ T cells to express IFN-γ. (C) Raw flow cytometry data, as well as (D) IFN-γ expression by the different T-cell subsets after stimulation with IL-12+IL-18 are shown (n = 6). (E) Neither IL-12 nor IL-18 alone induces IFN-γ expression by the CD161++ CD8+ T-cell population (n = 10). Each symbol represents an individual sample and bars represent means and SEM. Data shown are pooled from three experiments performed. ****p < 0.0001, one-way repeated measures ANOVA with Bonferroni's multiple comparison test.
Figure 2
Figure 2
IFN-γ expression was not dependent on TCR signaling. (A) PBMCs were stimulated either with IL-12+IL-18 or with E. coli ± anti-MR1 (5 μg/mL) (n = 7). (B) PBMCs were stimulated with either IL-12+IL-18 or anti-CD2/CD3/CD28 ± inhibitors cyclosporin A or SB203580 (n = 7). Relative IFN-γ expression was determined by FACS. Data are shown as mean ± SEM of the indicated number of samples and are pooled from two experiments performed. *p < 0.05, **p < 0.01, one-way repeated measures ANOVA with Bonferroni's multiple comparison test.
Figure 3
Figure 3
IFN-γ expression was not restricted to the MAIT cell subset of CD161++CD8+ T cells. (A) The percentage of CD161++CD8+ T cells that possess the Vα7.2 TCR. (B) The level of extracellular IL-18Rα expression was compared on the two CD161++CD8+ T cell subsets: Vα7.2+ and Vα7.2 (n = 6). (C) The level of IFN-γ after IL-12+IL-18 stimulation was also measured for the two Vα7.2 subsets (n = 6). (D) IL-18 was titrated into PBMC cultures in the presence of IL-12. The percentage of maximum IFN-γ expression, induced by IL-18 at 50 ng/mL, was used to compare sensitivity to lower IL-18 concentrations (n = 6). The levels of IFN-γ expression were determined by the geometric MFI of the IFN-γ+ population for each cell subset (n = 6). (A–C) Each symbol represents an individual population. (D) Data are shown as mean ± SEM of the indicated number of samples and are from one experiment representative of at least two performed. **p < 0.01, paired t-test.
Figure 4
Figure 4
Bacterial or TLR agonist stimulation leads to IL-12+IL-18-mediated activation of CD161++/MAIT cells. Percentage of IFN-γ expression by CD161++, CD161+, and CD161 CD8+ T cells cocultured with THP-1 cells exposed to (A) Escherichia coli or (B) Enterococcus faecalis, for 5 or 20 h (n = 8). IFN-γ expression was compared between cocultures of CD8+ T cells and THP-1 cells, cultured with (C) E. coli or (D) E. faecalis, in the presence or absence of blocking antibodies against IL-12, IL-18, MR1 (10 μg/mL), or isotype controls, for either 5 or 20 h. Data are presented as relative IFN-γ expression compared with that of cocultures in the absence of any antibodies. Each symbol represents an individual sample and bars represent means. *p < 0.05, **p < 0.01, ***p < 0.001, one-way repeated measures ANOVA with Bonferroni's multiple comparison test.
Figure 5
Figure 5
Toll-like receptor activation leads to IFN-γ expression by CD161++CD8+ T cells indirectly by IL-12+IL-18 expression. (A) THP-1 cells were stimulated overnight with TLR agonists (1–9), prior to coculture with CD8+ T cells. IFN-γ expression by CD161++CD8+ T cells was subsequently measured after a further 20 h incubation (n = 4). (B) LPS-stimulated THP-1 cells were cocultured with CD8+ T cells ± anti-IL-12, -IL-18, and -MR1 blocking antibodies (5 μg/mL) (n = 2). (C) PBMCs were stimulated for 24 h in the presence of TLR agonists (1–9) ± anti-MR1 and IFN-γ expression by CD161++CD8+ T cells measured (n = 8). (D) TLR8 agonist-induced IFN-γ expression following titration of blocking antibodies against IL-12p40 or IL-18 (n = 4). (E) TLR8 agonist signaling is dependent on TLR8 and the inflammasome. PBMCs were stimulated with the TLR8 agonist ± bafilomycin A or Z-WEHD (n = 7). Data are shown as mean ± SEM of the indicated number of samples and are pooled from two experiments performed. *p < 0.05, **p < 0.01, one-way repeated measures ANOVA with Bonferroni's multiple comparison test.

References

    1. Walker LJ, Kang Y-H, Smith MO, Tharmalingham H, Ramamurthy N, Fleming V, Sahgal N, et al. Human MAIT and CD8αα cells develop from a pool of type-17 pre-committed CD8+ T cells. Blood. 2011;119:422–433. - PMC - PubMed
    1. Treiner E. Lantz O. CD1d- and MR1-restricted invariant T cells: of mice and men. Curr. Opin. Immunol. 2006;18:519–526. - PubMed
    1. Tilloy F, Treiner E, Park SH, Garcia C, Lemonnier F, la Salle de H, Bendelac A, et al. An invariant T cell receptor alpha chain defines a novel TAP-independent major histocompatibility complex class Ib-restricted alpha/beta T cell subpopulation in mammals. J. Exp. Med. 1999;189:1907–1921. - PMC - PubMed
    1. Treiner E, Duban L, Bahram S, Radosavljevic M, Wanner V, Tilloy F, Affaticati P, et al. Selection of evolutionarily conserved mucosal-associated invariant T cells by MR1. Nature. 2003;422:164–169. - PubMed
    1. Huang S, Gilfillan S, Cella M, Miley MJ, Lantz O, Lybarger L, Fremont DH, et al. Evidence for MR1 antigen presentation to mucosal-associated invariant T cells. J. Biol. Chem. 2005;280:21183–21193. - PubMed

Publication types

MeSH terms