

The cost of overtriage: more than one-third of low-risk injured patients were taken to major trauma centers
- PMID: 24019364
- PMCID: PMC4044817
- DOI: 10.1377/hlthaff.2012.1142
The cost of overtriage: more than one-third of low-risk injured patients were taken to major trauma centers
Abstract
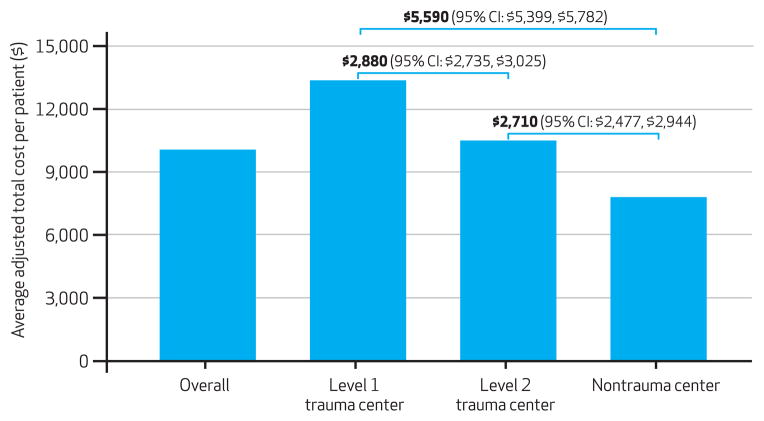
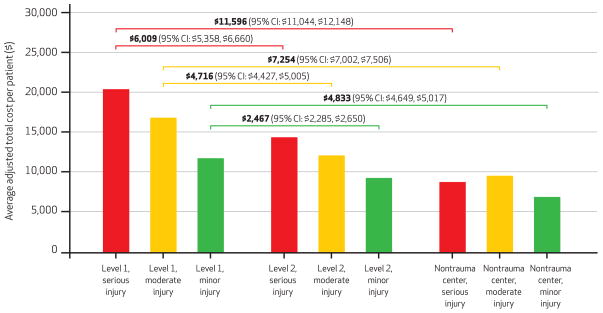
Regionalized trauma care has been widely implemented in the United States, with field triage by emergency medical services (EMS) playing an important role in identifying seriously injured patients for transport to major trauma centers. In this study we estimated hospital-level differences in the adjusted cost of acute care for injured patients transported by 94 EMS agencies to 122 hospitals in 7 regions, overall and by injury severity. Among 301,214 patients, the average adjusted per episode cost of care was $5,590 higher in a level 1 trauma center than in a nontrauma hospital. We found hospital-level differences in cost among patients with minor, moderate, and serious injuries. Of the 248,342 low-risk patients-those who did not meet field triage guidelines for transport to trauma centers-85,155 (34.3 percent) were still transported to major trauma centers, accounting for up to 40 percent of acute injury costs. Adhering to field triage guidelines that minimize the overtriage of low-risk injured patients to major trauma centers could save up to $136.7 million annually in the seven regions we studied.
Keywords: Clinical Issues; Cost Of Health Care; Emergency Care; Epidemiology; Hospitals; Organization And Delivery Of Care.
Figures
References
-
- Weir S, Salkever DS, Rivara FP, Jurkovich GJ, Nathens AB, Mackenzie EJ. One-year treatment costs of trauma care in the USA. Expert Rev Pharmacoecon Outcomes Res. 2010;10(2):187–97. - PubMed
-
- Centers for Disease Control and Prevention. Medical expenditures attributable to injuries—United States, 2000. MMWR Morb Mortal Wkly Rep. 2004;53(1):1–4. - PubMed
-
- Mann NC, Mackenzie E, Teitelbaum SD, Wright D, Anderson C. Trauma system structure and viability in the current healthcare environment: a state-by-state assessment. J Trauma. 2005;58(1):136–47. - PubMed
-
- MacKenzie EJ, Rivara FP, Jurkovich GJ, Nathens AB, Frey KP, Egleston BL, et al. A national evaluation of the effect of trauma-center care on mortality. N Engl J Med. 2006;354(4):366–78. - PubMed
Publication types
MeSH terms
Grants and funding
LinkOut - more resources
Full Text Sources
Other Literature Sources
Medical