

Broad-scale predictability of carbohydrates and exopolymers in Antarctic and Arctic sea ice
- PMID: 24019487
- PMCID: PMC3785782
- DOI: 10.1073/pnas.1302870110
Broad-scale predictability of carbohydrates and exopolymers in Antarctic and Arctic sea ice
Abstract
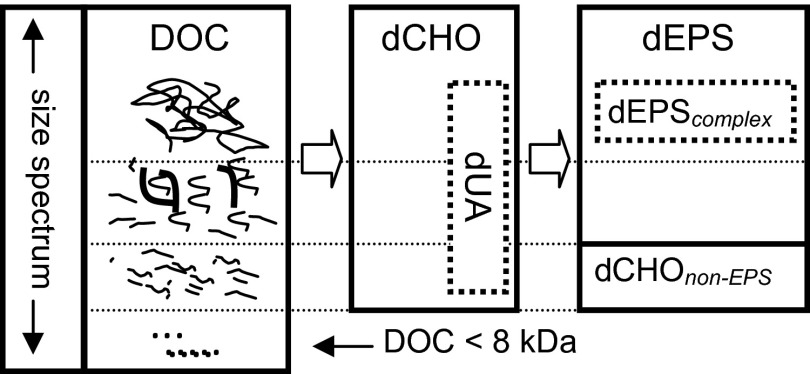
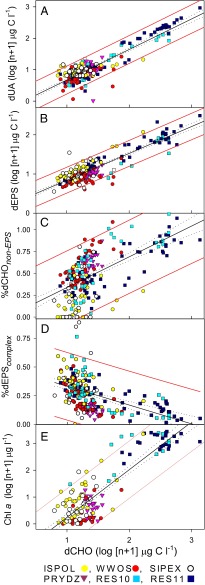
Sea ice can contain high concentrations of dissolved organic carbon (DOC), much of which is carbohydrate-rich extracellular polymeric substances (EPS) produced by microalgae and bacteria inhabiting the ice. Here we report the concentrations of dissolved carbohydrates (dCHO) and dissolved EPS (dEPS) in relation to algal standing stock [estimated by chlorophyll (Chl) a concentrations] in sea ice from six locations in the Southern and Arctic Oceans. Concentrations varied substantially within and between sampling sites, reflecting local ice conditions and biological content. However, combining all data revealed robust statistical relationships between dCHO concentrations and the concentrations of different dEPS fractions, Chl a, and DOC. These relationships were true for whole ice cores, bottom ice (biomass rich) sections, and colder surface ice. The distribution of dEPS was strongly correlated to algal biomass, with the highest concentrations of both dEPS and non-EPS carbohydrates in the bottom horizons of the ice. Complex EPS was more prevalent in colder surface sea ice horizons. Predictive models (validated against independent data) were derived to enable the estimation of dCHO concentrations from data on ice thickness, salinity, and vertical position in core. When Chl a data were included a higher level of prediction was obtained. The consistent patterns reflected in these relationships provide a strong basis for including estimates of regional and seasonal carbohydrate and dEPS carbon budgets in coupled physical-biogeochemical models, across different types of sea ice from both polar regions.
Keywords: algae; biogeochemistry; global relationships; microbial.
Conflict of interest statement
The authors declare no conflict of interest.
Figures


References
-
- Boé J, Hall A, Qu X. September sea-ice cover in the Arctic Ocean projected to vanish by 2100. Nat Geosci. 2009;2:341–343.
-
- Comiso JC. Variability and trends of the global sea ice cover. In: Thomas DN, Dieckmann GS, editors. Sea Ice. 2nd Edition. Oxford, UK: Wiley-Blackwell; 2010. pp. 205–246.
-
- Stroeve JC, et al. The Arctic’s rapidly shrinking sea ice cover: A research synthesis. Clim Change. 2012;110(3-4):1005–1027.
-
- Loose B, Miller LA, Elliott S, Papakyriakou T. Sea ice biogeochemistry and material transport across the frozen interface. Oceanography (Wash DC) 2011;24:202–218.
-
- Rysgaard S, et al. Sea ice contribution to the air–sea CO2 exchange in the Arctic and Southern Oceans. Tellus. 2011 63(5)B:823–830.
Publication types
MeSH terms
Substances
LinkOut - more resources
Full Text Sources
Other Literature Sources
Molecular Biology Databases
