. 2013 Sep 24;110(39):15555-60.
doi: 10.1073/pnas.1220313110. Epub 2013 Sep 9.

Micron-scale coherence in interphase chromatin dynamics

Affiliations

Micron-scale coherence in interphase chromatin dynamics

Alexandra Zidovska et al. Proc Natl Acad Sci U S A. .

Abstract

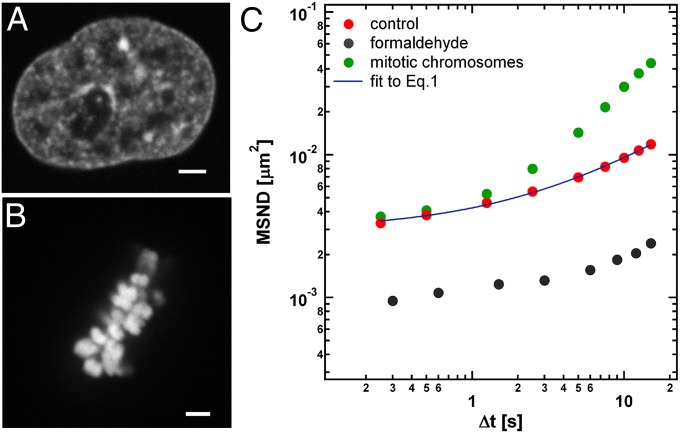
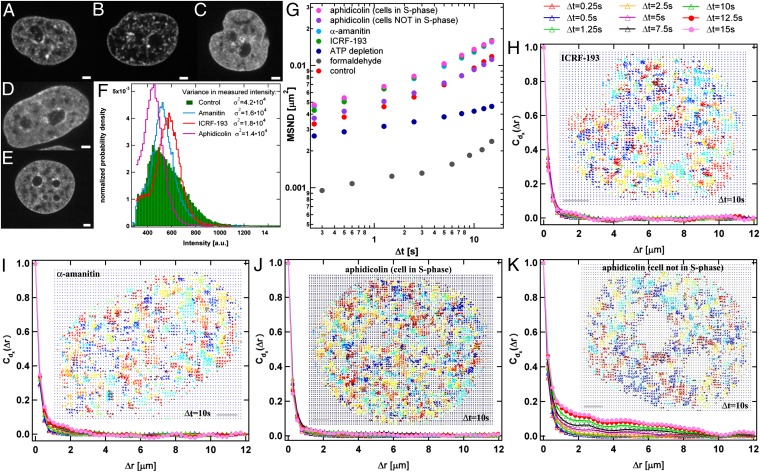
Chromatin structure and dynamics control all aspects of DNA biology yet are poorly understood, especially at large length scales. We developed an approach, displacement correlation spectroscopy based on time-resolved image correlation analysis, to map chromatin dynamics simultaneously across the whole nucleus in cultured human cells. This method revealed that chromatin movement was coherent across large regions (4-5 µm) for several seconds. Regions of coherent motion extended beyond the boundaries of single-chromosome territories, suggesting elastic coupling of motion over length scales much larger than those of genes. These large-scale, coupled motions were ATP dependent and unidirectional for several seconds, perhaps accounting for ATP-dependent directed movement of single genes. Perturbation of major nuclear ATPases such as DNA polymerase, RNA polymerase II, and topoisomerase II eliminated micron-scale coherence, while causing rapid, local movement to increase; i.e., local motions accelerated but became uncoupled from their neighbors. We observe similar trends in chromatin dynamics upon inducing a direct DNA damage; thus we hypothesize that this may be due to DNA damage responses that physically relax chromatin and block long-distance communication of forces.

Keywords: active materials; self-organization; soft matter.


Conflict of interest statement

The authors declare no conflict of interest.

Figures

Fig. 1.
Fig. 1.
Bulk chromatin dynamics. (A) Image of an interphase nucleus expressing H2B-GFP. (B) Mitotic chromosome cluster expressing H2B-GFP. (C) MSND(Δt)= <|d(r,Δt)|2>, calculated from displacements d(r,Δt) measured by DCS averaging over 16 cells in interphase (red circles). Blue solid line represents the fit of the experimental data to Eq. 1. MSND measured for cells fixed in formaldehyde (gray circles) reveals much lower MSND values, thus confirming that measured values are above the noise floor. MSND measured for mitotic chromosomes (green circles) serves as a positive control. (Scale bar, 2 µm.)
Fig. 2.
Fig. 2.
Local coherence in interphase chromatin dynamics. Shown are DCS maps of the same nucleus calculated for different time intervals Δt: (A) Δt = 0.25 s, (B) Δt = 2.5 s, and (C) Δt = 5 s. Displacement vectors are color coded by their direction to reveal directional correlation. In A the motion is uncorrelated, whereas in B and C regions of correlated motion can be observed. (D) Sequential DCS maps calculated at different times t for time interval Δt = 10 s. The regions of correlated motion seem to disintegrate over tens of seconds, while new regions of correlated motions are formed. Figs. S2 and S3 show corresponding confocal microscopy images and high-resolution images of A–D, respectively. (E) We calculate average spatial displacement autocorrelation function <cdx(Δr,Δt)> for a Δt by averaging over all cdx(Δr,Δt) calculated for single DCS fields at given Δt. The plot shows <cdx(Δr,Δt)> for different Δt. First, an increase in correlation can be observed for Δt = 0.25–5 s, then the correlation reaches its maximum at Δt = 5–10 s, and then it decreases again. (F) Examples of cdx(Δr,Δt) calculated for single fields for Δt = 2.5 s, 5 s, and 10 s. The log-log plots of cdx(Δr,Δt) show an initial power law behavior followed by an abrupt fall consistent with a power law with an exponential cutoff. We fit cdx(Δr,Δt) of single fields to Eq. 2 to obtain the scaling exponent n and the correlation length ξ (yellow solid line). (G) Plot of the average correlation length ξ and scaling exponent n as a function of Δt. We obtain ξ and n by fitting cdx(Δr,Δt) of single DCS fields to Eq. 2 and then averaging over all fields at a Δt and all cells (n = 16) . (Scale bar, 2 µm.)
Fig. 3.
Fig. 3.
Regions of coherent motion vs. chromatin territories. (A) A fluorescent image of an interphase nucleus expressing H2B-GFP. (B) Chromosome territories visualized by incorporation of Cy3-dCTP. (C) An overlay of A and B. (D) An overlay of B and DCS vector map. There are instances where boundaries of regions of correlated motion correspond to boundaries between labeled and unlabeled territories (Inset A). However, we also find many examples where regions of correlated motion span across several territories (Inset B). Therefore, we conclude that regions of correlated motion are not chromosome territories in most cases. Fig. S4 shows a high-resolution image (D). (E and F) A model for the two observed regimes of the chromatin dynamics. Blue and green chains represent distinct chromosomes. In E, regions of coherent motion correspond to chromosome territories; in F, regions of coherent motion span beyond the chromosome territories; i.e., parts of different chromosomes are moving coherently (red or blue box). (Scale bar, 2 µm.)
Fig. 4.
Fig. 4.
Chromatin perturbations. Shown are changes in phenotype upon perturbations: (A–E) control (A); after ATP depletion (B); and upon addition of ICRF-193 (topoisomerase II inhibitor) (C), α-amanitin (polymerase II inhibitor) (D), and aphidicolin (DNA polymerase inhibitor) (E). (F) Histograms of normalized intensities for A–E demonstrate the difference in the variance σ2 of fluorescence intensity distributions corresponding to changes in chromatin concentration distributions. After DNA damage is induced (C–E), σ2 is lowered compared with control (F). (G) MSND measured for aphidicolin (n = 15), ICRF-193 (n = 9), and α-amanitin (n = 9) shows an increase in local displacements, whereas ATP depletion (n = 10) causes a reduction in local displacements. As a negative control we measured displacement in a sample fixed by formaldehyde (n = 5). Note the S-phase–specific behavior of cells treated with aphidicolin; cells in S phase (pink circles) react to aphidicolin perturbation, whereas cells not in S phase (purple circles) retain physiological behavior. All three drugs cause strong inhibition of local coherence: (H) ICRF-193, (I) α-amanitin, and (J) aphidicolin. For aphidicolin the effect is seen only in ∼35% of cells, which are shown by EdU stain to be in early-to-mid S phase, confirming the aphidicolin effect is S-phase specific (Fig. S6). (K) Cells not in S phase retained the local coherence in the chromatin dynamics upon treatment with aphidicolin. Fig. S7 shows high-resolution images of H–K. (Scale bar, 2 µm.)

Similar articles

Cited by

References

    1. Alberts B (2002) Molecular Biology of The Cell (Garland Science, New York)
    1. Lengauer C, et al. Chromosomal bar codes produced by multicolor fluorescence in situ hybridization with multiple YAC clones and whole chromosome painting probes. Hum Mol Genet. 1993;2(5):505–512. - PubMed
    1. Cremer T, Cremer C. Chromosome territories, nuclear architecture and gene regulation in mammalian cells. Nat Rev Genet. 2001;2(4):292–301. - PubMed
    1. Cremer T, Küpper K, Dietzel S, Fakan S. Higher order chromatin architecture in the cell nucleus: On the way from structure to function. Biol Cell. 2004;96(8):555–567. - PubMed
    1. Lieberman-Aiden E, et al. Comprehensive mapping of long-range interactions reveals folding principles of the human genome. Science. 2009;326(5950):289–293. - PMC - PubMed

Publication types

LinkOut - more resources