. 2013 Sep 16;202(6):901-16.
doi: 10.1083/jcb.201301115. Epub 2013 Sep 9.

Rap1 potentiates endothelial cell junctions by spatially controlling myosin II activity and actin organization

Affiliations

Rap1 potentiates endothelial cell junctions by spatially controlling myosin II activity and actin organization

Koji Ando et al. J Cell Biol. .

Abstract

Reorganization of the actin cytoskeleton is responsible for dynamic regulation of endothelial cell (EC) barrier function. Circumferential actin bundles (CAB) promote formation of linear adherens junctions (AJs) and tightening of EC junctions, whereas formation of radial stress fibers (RSF) connected to punctate AJs occurs during junction remodeling. The small GTPase Rap1 induces CAB formation to potentiate EC junctions; however, the mechanism underlying Rap1-induced CAB formation remains unknown. Here, we show that myotonic dystrophy kinase-related CDC42-binding kinase (MRCK)-mediated activation of non-muscle myosin II (NM-II) at cell-cell contacts is essential for Rap1-induced CAB formation. Our data suggest that Rap1 induces FGD5-dependent Cdc42 activation at cell-cell junctions to locally activate the NM-II through MRCK, thereby inducing CAB formation. We further reveal that Rap1 suppresses the NM-II activity stimulated by the Rho-ROCK pathway, leading to dissolution of RSF. These findings imply that Rap1 potentiates EC junctions by spatially controlling NM-II activity through activation of the Cdc42-MRCK pathway and suppression of the Rho-ROCK pathway.


Figures
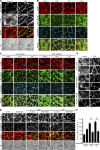
Figure 1.
Figure 1.
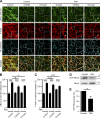
NM-II is required for Rap1-induced CAB formation. (A) Monolayer-cultured HUVECs plated on collagen-coated dishes were stimulated with vehicle (Control) or 10 µM FSK for 20 min, immunostained with anti–VE-cadherin antibody, and stained with rhodamine-phalloidin (F-actin). VE-cadherin and F-actin images, the merged images (VE-cadherin, green; F-actin, red), and the bright field (BF) images are shown. (B) HUVECs were simulated with vehicle (Control), 10 µM FSK, 1 mM 8-pCPT-2’-O-methyl-cAMP (007), or 0.5 mM 6-Bnz for 20 min (the cells were stimulated with FSK, 007, and 6-Bnz at these concentrations for 20 min throughout the following experiments unless otherwise indicated), stained with rhodamine-phalloidin (F-actin), and immunostained with anti-pRLC (phosphorylated regulatory myosin light chain) at Ser19 (pRLC (Ser19)) and anti–VE-cadherin antibodies. F-actin, pRLC (Ser19), VE-cadherin images, and the merged images are shown. (C) HUVECs transfected with control siRNA or Rap1 siRNA #1 were stimulated with vehicle (Control), FSK, or 007, and stained similar to as in B. (D) HUVECs transfected with siRNA indicated at the left (control or two independent mixtures, #1 and #2, of NM-IIA and NM-IIB) were stimulated with vehicle (Control) or FSK, and stained with rhodamine-phalloidin. (E) HUVECs were pretreated with or without 20 µM blebbistatin for 4 h, stimulated with vehicle, FSK, or 007, and stained similar to as in A. (F) The F-actin that accumulated at cell–cell contacts, as observed in E, was quantified. Values are expressed as a percentage relative to that in the blebbistatin-untreated cells stimulated with vehicle, and shown as mean ± SEM (error bars) from three independent experiments (n ≥ 80). **, P < 0.01, significant difference between two groups. In A and C–E, the boxed areas are enlarged in the insets (A, C, and E), or below the original images (D). Arrowheads (B–D) and parentheses (B) indicate cell–cell junctions and stress fibers, respectively. Bars, 10 µm.
Figure 2.
Figure 2.
The Rho–ROCK–NM-II pathway is required for RSF formation, but not for CAB formation. (A) Monolayer-cultured HUVECs were treated without (Control) or with either 10 µg/ml C3 toxin for 24 h or 50 µM Y27632 for 30 min, stimulated with vehicle (Control) or FSK, and stained similar to as in Fig. 1 B. The boxed areas are enlarged in the insets. Arrowheads and brackets indicate cell–cell junctions and stress fibers, respectively. Bars, 10 µm. (B and C) Quantitative relative expression values of pRLC at Ser19 (B) and F-actin (C) at cell–cell contacts compared to those in the control cells without FSK stimulation observed in A are shown as mean ± SEM from three independent experiments (error bars; n ≥ 209). (D and E) GTP-bound form of RhoA (GTP-RhoA) and total RhoA (RhoA) in the HUVECs stimulated with vehicle (Control) or FSK for 30 min were analyzed. In E, values are expressed as a percentage relative to that in control cells, and shown as mean ± SEM (error bars; n ≥ 7). *, P < 0.05; ***, P < 0.001, significant difference between two groups. n.s., no significance between two groups.
Figure 3.
Figure 3.
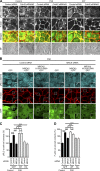
MRCK is required for Rap1-induced NM-II activation leading to CAB formation. (A) HUVECs were stimulated with vehicle (Control) or FSK, immunostained with the antibodies indicated in the top panels, and stained with rhodamine-phalloidin (F-actin). pRLC (Ser19) or ppRLC (Thr18/Ser19) images, F-actin images, and the merged images (pRLC (Ser19) or ppRLC (Thr18/Ser19), green; F-actin, red) are shown. (B) Lysates from the HUVECs transfected without (No siRNA) or with control siRNA or MRCK siRNA targeting both MRCKα and MRCKβ for 2 d were subjected to Western blot analyses with anti-MRCKα, anti-MRCKβ, and anti–β-actin antibodies. (C) HUVECs transfected with control or MRCK siRNA were stimulated with vehicle (Control) or FSK, and stained similar to as in Fig. 1 B. (D and E) Quantitative relative expression values of pRLC at Ser19 (D) and F-actin (E) at cell–cell contacts compared to those in control siRNA-transfected cells without FSK stimulation observed in C were expressed as mean ± SEM (error bars; n ≥ 40). Similar results were obtained in three independent experiments. (F) HUVECs expressing either GFP or siRNA-insensitive MRCKβ-GFP were transfected with control or MRCK siRNA, stimulated with FSK, immunostained with anti-pRLC at Ser19 (pRLC (Ser19)) antibody, and stained with rhodamine-phalloidin (F-actin). pRLC (Ser19), F-actin, and GFP images are shown. Note that GFP signal at cell–cell contacts between the cells expressing GFP is ascribed to the overlap of plasma membrane (see Fig. S3 A). (G and H) Quantitative relative expression values of pRLC at Ser19 (G) and F-actin (H) at cell–cell contacts compared to those in GFP-expressing and control siRNA-transfected cells without FSK stimulation observed in F are given as mean ± SEM (error bars; n ≥ 40). Similar results were obtained in three independent experiments. In A, C, and F, the boxed areas are enlarged in the insets. Arrowheads (A, C, and F) and brackets (C) indicate cell–cell junctions and stress fibers, respectively. *, P < 0.05; **, P < 0.01; ***, P < 0.001, significant difference between two groups. n.s., no significance between two groups. Bars, 10 µm.
Figure 4.
Figure 4.
Rap1-dependent translocation of MRCK to cell–cell junctions is mediated by Cdc42. (A) HUVECs transfected with the plasmid encoding MRCKβ-GFP were stimulated with vehicle (Control) or FSK. GFP (MRCKβ-GFP) and bright field (BF) images are shown. The boxed areas are enlarged in the panels to the right of the original images. (B) HUVECs transfected with the plasmid encoding MRCKβ-GFP together with Rap1 siRNA #1 were stimulated with FSK similar to as in A. (C) 293T cells were transfected with the plasmid encoding either MRCKβ-GFP or MRCKβ H1593/1596A-GFP together with the vector expressing either FLAG-tagged wild type or constitutive active mutant of Cdc42 (Cdc42 WT and Cdc42 G12V), RhoA (RhoA WT and RhoA Q63L), and Rac1 (Rac1 WT and Rac1 G12V), as indicated at the top. Immunoprecipitates (IP: FLAG) of cell lysates and aliquots of total cell lysates (TCL) were subjected to Western blot analyses with anti-GFP and anti-FLAG antibodies as indicated on the left. (D) HUVECs transfected with either control siRNA or Cdc42 siRNA for 48 h were subsequently transfected with the vector encoding MRCKβ-GFP for 24 h, and stimulated with FSK similar to as in A. The boxed areas are enlarged in the insets. (E) HUVECs transfected with the plasmid encoding either MRCKβ-GFP or MRCKβ H1593/1596A-GFP were stimulated with 007 similar to as in A. Arrowheads indicate cell–cell junctions. Bars: (low magnification images in A and B, D, and E) 10 µm; (high magnification images in A and B) 5 µm.
Figure 5.
Figure 5.
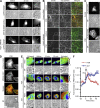
Rap1 induces accumulation of active Cdc42 at cell–cell junctions. (A) HUVECs transfected with the N-WASP–expressing plasmids indicated on the left, GFP-tagged CRIB domain of N-WASP (GFP-N-WASP), or the mutant lacking Cdc42 binding site (GFP-N-WASP H211D) were stimulated with 007. The cells transfected with the plasmid encoding GFP-N-WASP together with Rap1 siRNA #1 were also stimulated with 007 (bottom two rows). GFP and bright field (BF) images acquired before and 20 min after the stimulation are shown. (B) HUVECs transfected with either control siRNA or Cdc42 siRNA #3 were stimulated with vehicle (Control) or FSK and immunostained with anti-Cdc42 and anti–VE-cadherin antibodies. Images of Cdc42 and VE-cadherin and the merged images (Cdc42, red; VE-cadherin, green) are shown. (C) HUVECs transfected with the plasmid expressing FLAG-Cdc42 were stimulated with either vehicle (Control) or FSK and immunostained with anti-FLAG antibody. FLAG-Cdc42 and BF images are shown. (D) HUVECs cotransfected with the plasmid encoding mCherry-Cdc42 and that encoding MRCKβ-GFP were stimulated with FSK. mCherry (mCherry-Cdc42) and GFP (MRCKβ-GFP) images, the merged images (mCherry, red; GFP, green) and the BF images are shown. (E) HUVECs expressing RaichuEV-Cdc42, a FRET-based Cdc42 activity-monitoring probe, were stimulated with vehicle (Control), FSK, or 007 and subjected to time-lapse FRET imaging. The images were obtained every 2 min for 16 min before and 50 min after the stimulation. Representative ratio images of FRET/CFP at the indicated time points are shown in the intensity-modulated display mode (IMD). The upper and lower limits of the ratio image with IMD are indicated on the right. The boxed areas in the images acquired before and after the stimulation are enlarged on the left and right sides of the original images, respectively. (F) The fold increase of the FRET/CFP ratio observed in E was calculated by dividing the FRET/CFP ratio in the cells stimulated with either FSK (red line) or 007 (blue line) by those in the vehicle-treated cells at the corresponding time points. The drugs were added to the culture media at time 0 as indicated by the arrow. Data are expressed as fold increase relative to that at time 0, and shown as mean ± SEM (error bars) of seven independent experiments. Significant differences between the value at 0 min and that at 8 min after the stimulation are indicated as *, P < 0.05. The boxed areas are enlarged on the right side of the original images (A) or in the insets (B–D). Arrowheads indicate cell–cell junctions. Bars, 10 µm.
Figure 6.
Figure 6.
Cdc42 is required for Rap1-induced activation of NM-II and formation of CAB at cell–cell junctions. (A) HUVECs transfected with either control siRNA or Cdc42 siRNA #3 were stimulated with vehicle (Control), FSK, or 007, immunostained with anti-pRLC at Ser19 (pRLC (Ser19)) antibody, and stained with rhodamine-phalloidin (F-actin). pRLC (Ser19) and F-actin images, the merged images (F-actin, red; pRLC (Ser19), green), and the bright field images (BF) are shown. Bars, 10 µm. (B) HUVECs expressing GFP, siRNA-insensitive MRCKβ-GFP, or siRNA-insensitive MRCKβ H1593/1596A-GFP were transfected with either control siRNA or MRCK siRNA, stimulated with FSK, and stained similar to as in Fig. 3 F. Arrowheads indicate cell–cell junctions. Bars, 10 µm. (C and D) Quantitative relative values of pRLC at Ser19 (C) and F-actin (D) at cell–cell contacts in the cells expressing GFP, MRCKβ-GFP (WT), or MRCKβ H1593/1596A-GFP (HA) compared to those in GFP-expressing and control siRNA-transfected cells without FSK stimulation observed in B are shown as mean ± SEM (error bars; n ≥ 40). Similar results were obtained in three independent experiments. ***, P < 0.01, significant difference between two groups. n.s., no significance between two groups.
Figure 7.
Figure 7.
FGD5 is required for Rap1-induced CAB formation via activation of Cdc42 at cell–cell junctions. (A) HUVECs transfected with control siRNA or Rap1 siRNA #1 were stimulated with vehicle (Control) or FSK, and immunostained with anti-FGD5 and anti–VE-cadherin antibodies. (B) Quantitative relative expression values of FGD5 at cell–cell contacts compared to those in control siRNA-transfected cells stimulated with vehicle observed in A are shown as mean ± SEM (error bars) from three independent experiments (n ≥ 80). (C) RaichuEV-Cdc42–expressing HUVECs transfected with control siRNA or FGD5 siRNA #1 were stimulated with vehicle (Control) or FSK, and subjected to time-lapse FRET imaging similar to as in Fig. 5 E. The fold increase in FRET/CFP ratios 10 min after the stimulation were calculated similar to as in Fig. 5 F and shown as mean ± SEM (error bars) from four independent experiments (n ≥ 36). (D) HUVECs transfected with either control siRNA or FGD5 siRNA #1 for 48 h were subsequently transfected with the plasmid encoding GFP-N-WASP for 24 h, stimulated with vehicle (Control) or FSK, and stained with rhodamine-phalloidin (F-actin). GFP (GFP-N-WASP), F-actin, and bright field (BF) images are shown. (E) HUVECs transfected with the plasmid encoding GFP-Cdc42 together with either control siRNA or FGD5 siRNA #1 were stimulated with FSK, and stained with rhodamine-phalloidin. GFP and F-actin images, the merged images (GFP, green; F-actin, red), and BF images are shown. (F) HUVECs transfected with either control siRNA or FGD5 siRNA #1 were stimulated similar to as in Fig. 1 B. (G and H) Quantitative relative expression values of pRLC at Ser19 (G) and F-actin (H) at cell–cell contacts compared to those in control siRNA-transfected cells treated with vehicle in F are shown as mean ± SEM (error bars; n = 33). Similar results were obtained in three independent experiments. In A, D, and E, the boxed areas are enlarged in the insets. In D and E, arrowheads indicate cell–cell junctions. *, P < 0.05; **, P < 0.01; ***, P < 0.001, significant difference between two groups. n.s., no significance between two groups. Bars, 10 µm.
Figure 8.
Figure 8.
The FGD5–Cdc42–MRCK–NM-II pathway is essential for Rap1-induced potentiation of EC barrier function. (A) VE-cadherin–GFP-expressing HUVECs transfected with control or MRCK siRNA were stimulated with vehicle (Control) or FSK and subjected to FRAP analysis. Representative GFP images before and at the indicated time points after photobleaching (at 0 min) are shown. The photobleached regions are boxed and enlarged beneath the original images. Bars: (top panels) 10 µm; (bottom panels) 5 µm. (B) Quantitative analysis of FRAP experiments in A. A plot of relative fluorescence intensity of VE-cadherin-GFP compared to that of pre-photobleaching in control siRNA-transfected cells stimulated with vehicle (black) or FSK (red) or in MRCK siRNA-transfected cells stimulated with vehicle (green) or FSK (blue) is shown as mean ± SEM (error bars; n ≥ 5). (C) The mobile fractions of VE-cadherin-GFP calculated from the fluorescence recovery curves observed in B are shown. Bars and circles indicate averages and individual data points, respectively (n ≥ 5). (D–G) The junctional resistance between the adjacent cells (Rb) was measured using the ESIC system as described in the Materials and methods section. Relative Rb values to the matched control at 30 min after the stimulation are shown. Bars and circles indicate averages and individual data points, respectively (n ≥ 3). In D, confluent HUVECs cultured for overnight were stimulated with vehicle, FSK, or 007 in the absence or presence of blebbistatin. The control value is that in blebbistatin-untreated cells stimulated with vehicle. In E, F, and G, HUVECs transfected with control siRNA or MRCK (E), Cdc42 #3 (F), or FGD5 #2 siRNA (G) were stimulated with vehicle, FSK, or 007. The control values are those in the control siRNA-transfected cells stimulated with vehicle. (H) EC permeability in the monolayer-cultured HUVECs stimulated with vehicle or FSK in the absence or presence of blebbistatin was analyzed. Relative permeability of each group of the cells compared with that in blebbistatin-untreated cells stimulated with vehicle is shown. (I) EC permeability in control siRNA– or MRCK siRNA–transfected HUVECs stimulated with vehicle or FSK was analyzed. Relative permeability of each group of the cells compared with that in control siRNA-transfected cells stimulated with vehicle is shown. In H and I, bars and circles indicate averages and individual data points, respectively (n ≥ 3). *, P < 0.05; **, P < 0.01; ***, P < 0.001, significant difference between two groups. n.s., no significance between two groups.
Figure 9.
Figure 9.
Schematic representation of the model that accounts for how Rap1 potentiates EC junctions. In the ECs that establish weak cell–cell adhesions, the Rho–ROCK–NM-II pathway induces formation of RSF connecting to punctate AJs. Once activated, Rap1 induces disruption of RSF through inhibition of the Rho–ROCK–NM-II pathway and formation of CAB supporting linear AJs through activation of the Cdc42–MRCK–NM-II pathway, thereby potentiating EC junctions. Thus, Rap1 tunes the NM-II activity by regulating two Rho family GTPases to control EC junctions.

References

    1. Abraham S., Yeo M., Montero-Balaguer M., Paterson H., Dejana E., Marshall C.J., Mavria G. 2009. VE-Cadherin-mediated cell-cell interaction suppresses sprouting via signaling to MLC2 phosphorylation. Curr. Biol. 19:668–674 10.1016/j.cub.2009.02.057 - DOI - PubMed
    1. Aoki K., Nakamura T., Fujikawa K., Matsuda M. 2005. Local phosphatidylinositol 3,4,5-trisphosphate accumulation recruits Vav2 and Vav3 to activate Rac1/Cdc42 and initiate neurite outgrowth in nerve growth factor-stimulated PC12 cells. Mol. Biol. Cell. 16:2207–2217 10.1091/mbc.E04-10-0904 - DOI - PMC - PubMed
    1. Augustin H.G., Koh G.Y., Thurston G., Alitalo K. 2009. Control of vascular morphogenesis and homeostasis through the angiopoietin-Tie system. Nat. Rev. Mol. Cell Biol. 10:165–177 10.1038/nrm2639 - DOI - PubMed
    1. Ayollo D.V., Zhitnyak I.Y., Vasiliev J.M., Gloushankova N.A. 2009. Rearrangements of the actin cytoskeleton and E-cadherin-based adherens junctions caused by neoplasic transformation change cell-cell interactions. PLoS ONE. 4:e8027 10.1371/journal.pone.0008027 - DOI - PMC - PubMed
    1. Borikova A.L., Dibble C.F., Sciaky N., Welch C.M., Abell A.N., Bencharit S., Johnson G.L. 2010. Rho kinase inhibition rescues the endothelial cell cerebral cavernous malformation phenotype. J. Biol. Chem. 285:11760–11764 10.1074/jbc.C109.097220 - DOI - PMC - PubMed

Publication types

MeSH terms