. 2013 Sep 16;202(6):917-35.
doi: 10.1083/jcb.201302041. Epub 2013 Sep 9.

RCP-driven α5β1 recycling suppresses Rac and promotes RhoA activity via the RacGAP1-IQGAP1 complex

Affiliations

RCP-driven α5β1 recycling suppresses Rac and promotes RhoA activity via the RacGAP1-IQGAP1 complex

Guillaume Jacquemet et al. J Cell Biol. .

Abstract

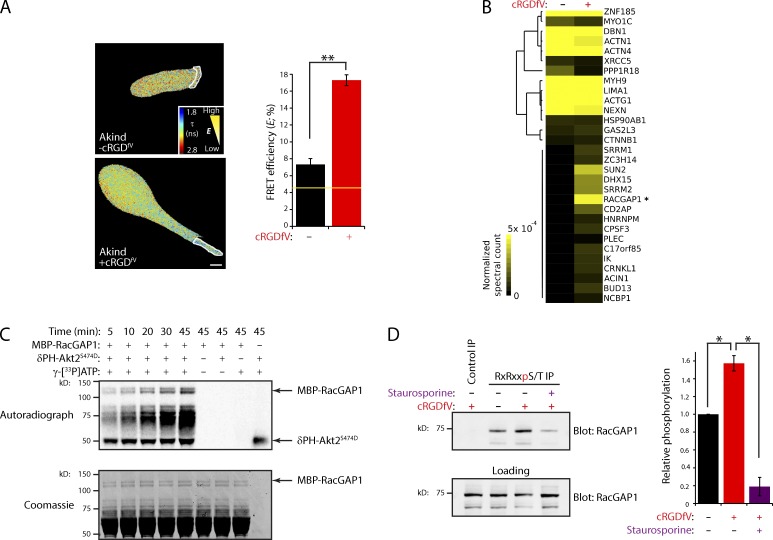
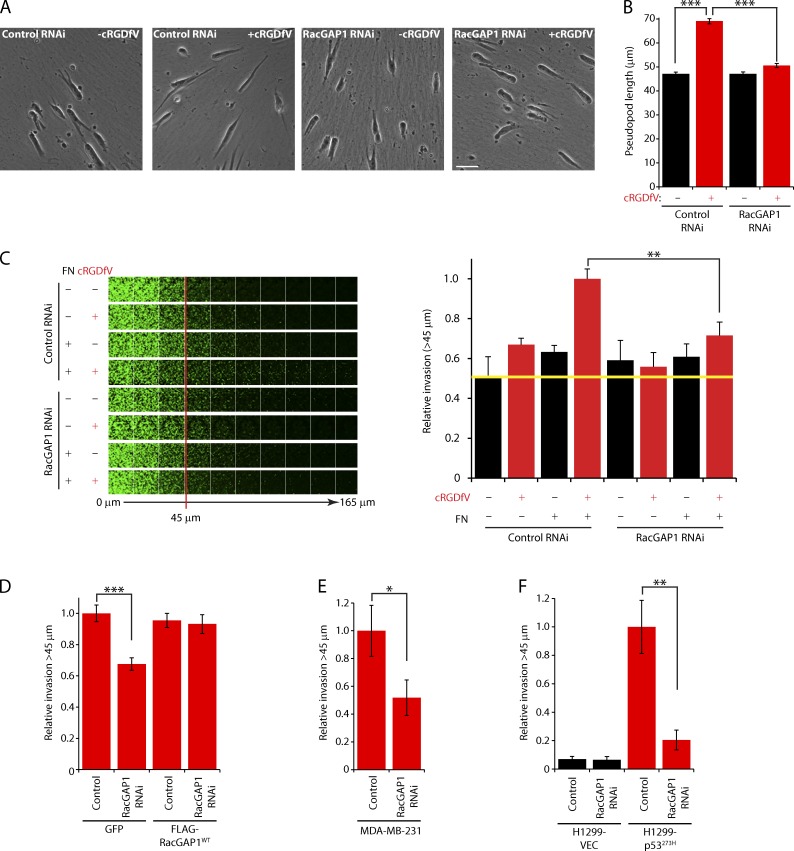
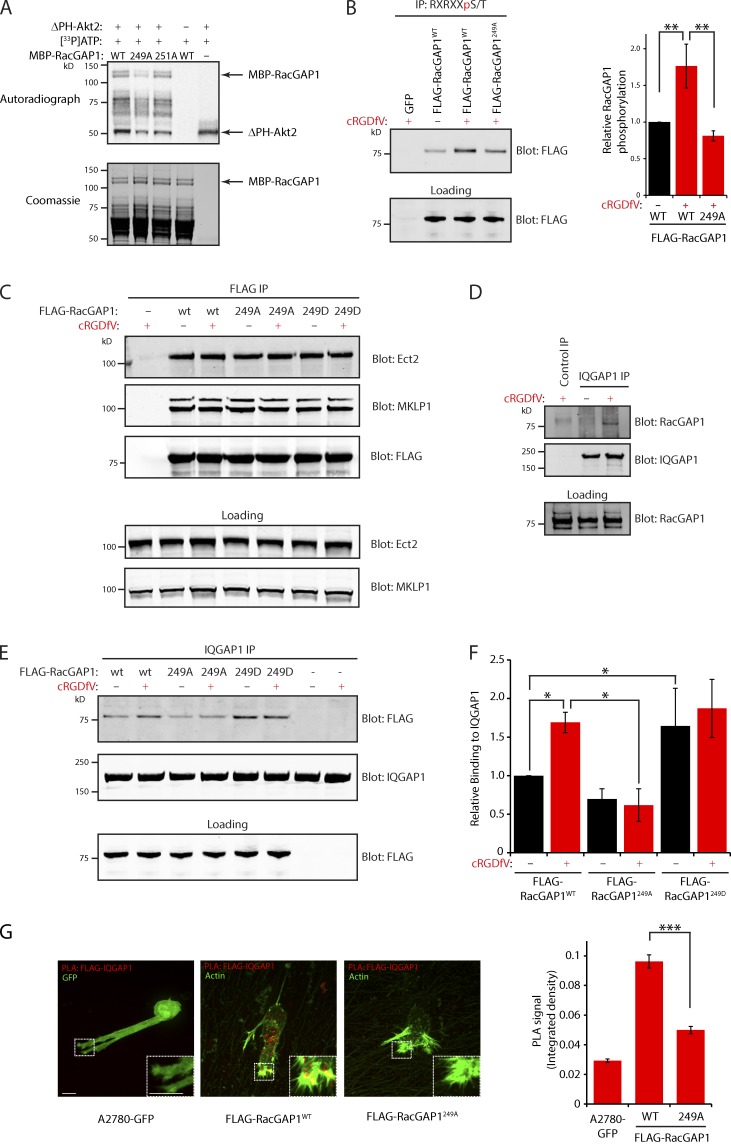
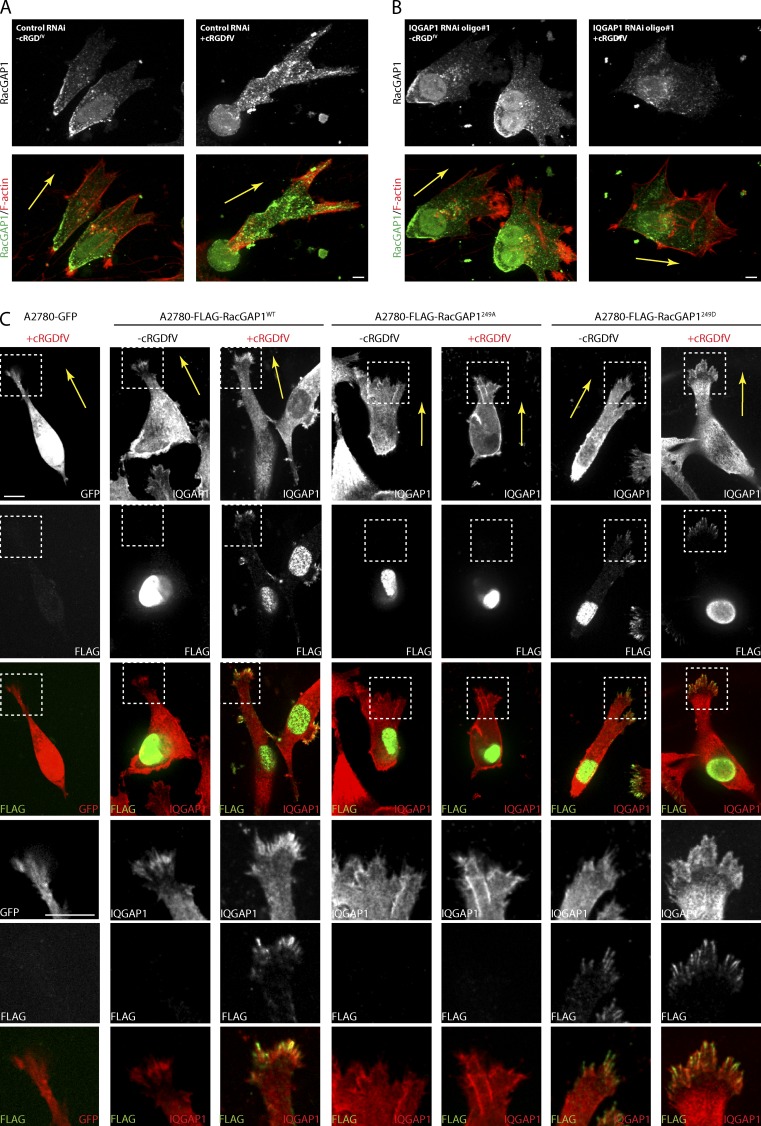
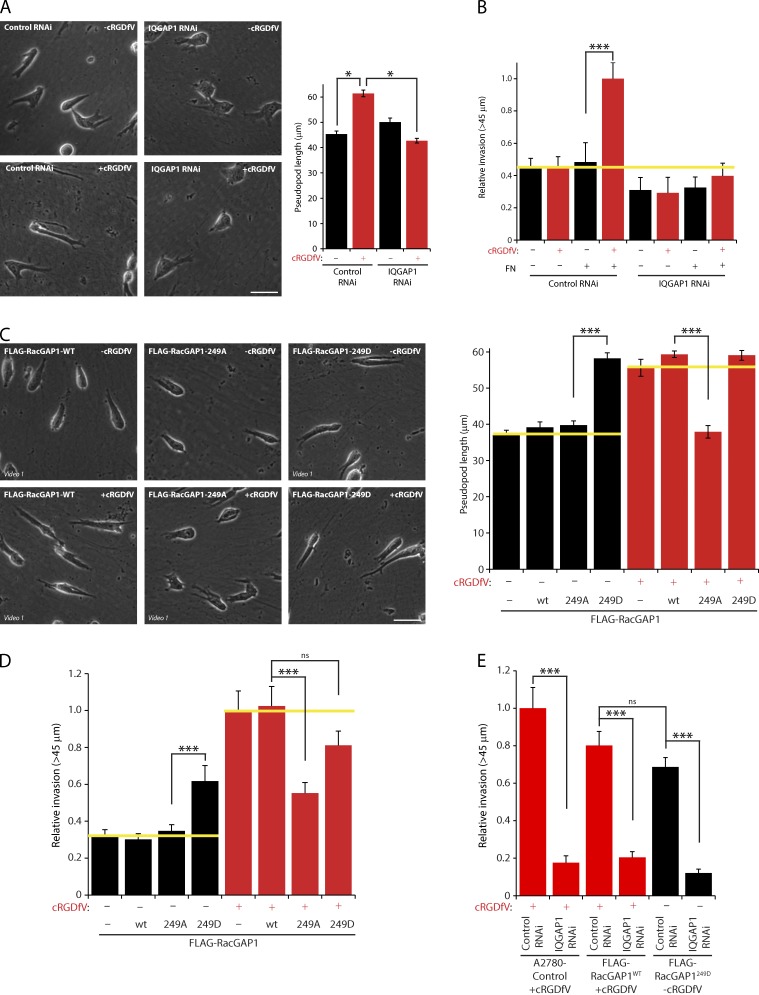
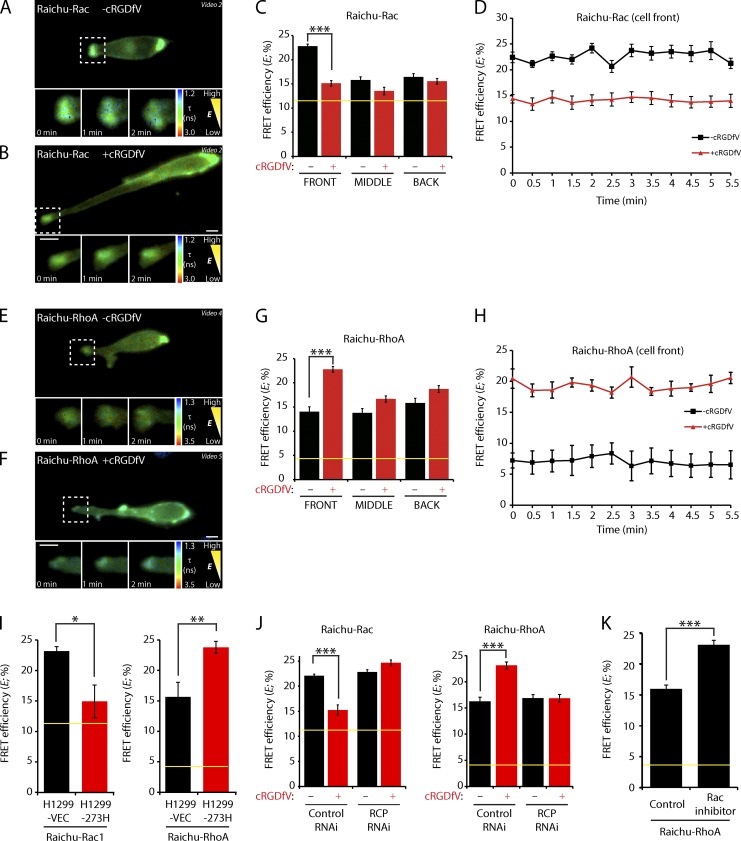
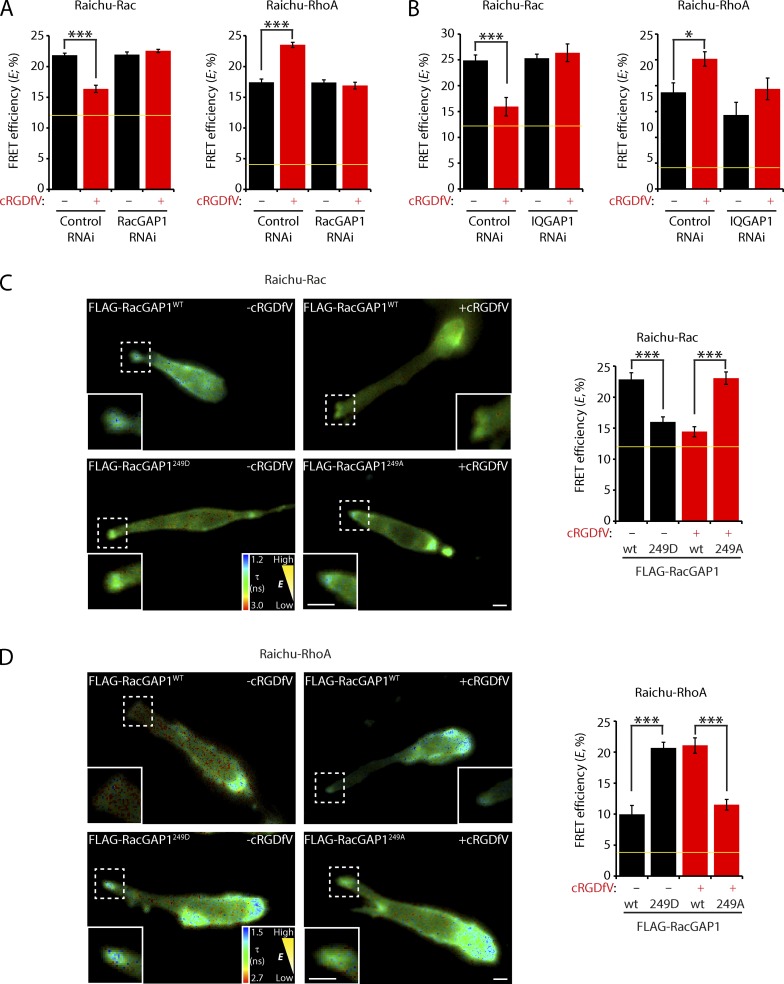
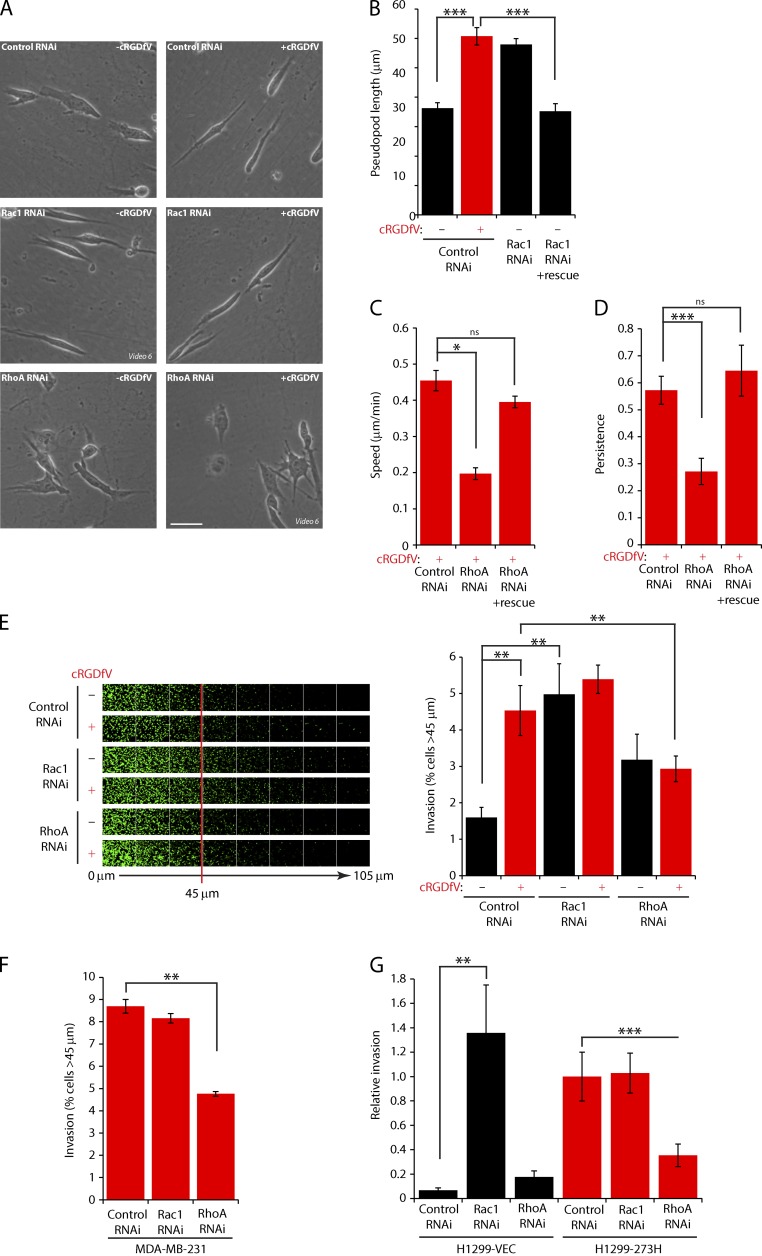
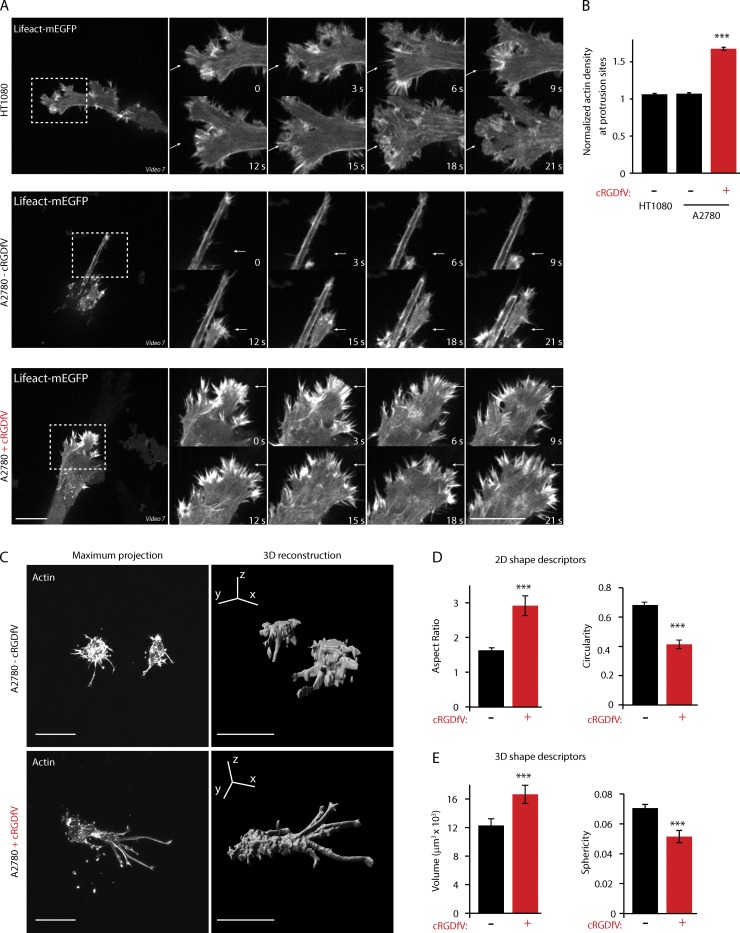
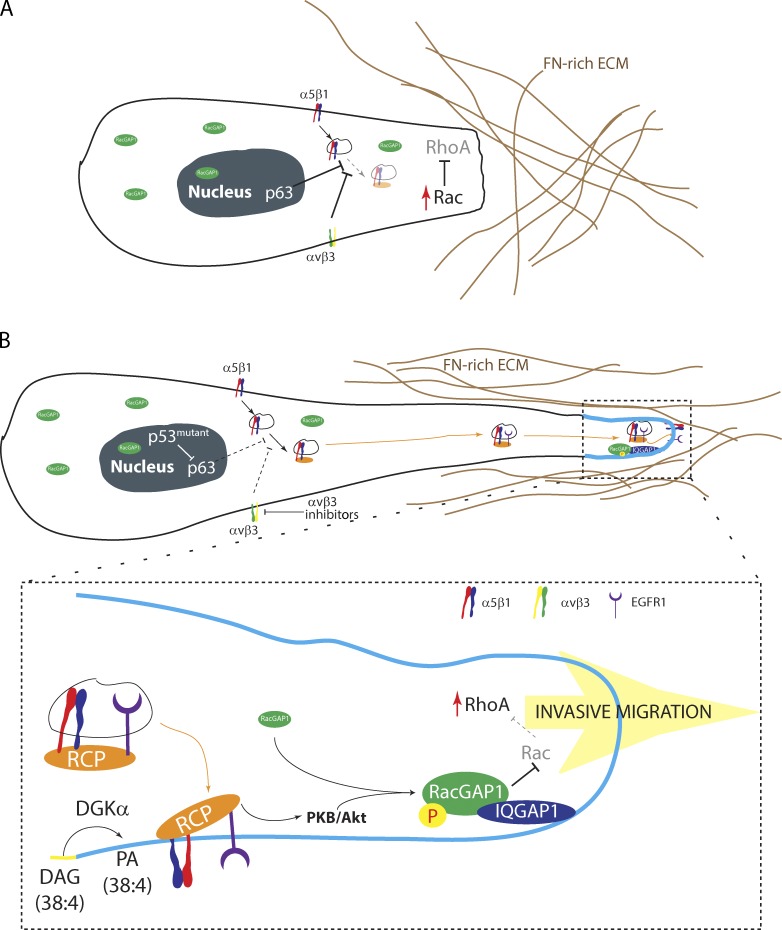
Inhibition of αvβ3 or expression of mutant p53 promotes invasion into fibronectin (FN)-containing extracellular matrix (ECM) by enhancing Rab-coupling protein (RCP)-dependent recycling of α5β1 integrin. RCP and α5β1 cooperatively recruit receptor tyrosine kinases, including EGFR1, to regulate their trafficking and downstream signaling via protein kinase B (PKB)/Akt, which, in turn, promotes invasive migration. In this paper, we identify a novel PKB/Akt substrate, RacGAP1, which is phosphorylated as a consequence of RCP-dependent α5β1 trafficking. Phosphorylation of RacGAP1 promotes its recruitment to IQGAP1 at the tips of invasive pseudopods, and RacGAP1 then locally suppresses the activity of the cytoskeletal regulator Rac and promotes the activity of RhoA in this subcellular region. This Rac to RhoA switch promotes the extension of pseudopodial processes and invasive migration into FN-containing matrices, in a RhoA-dependent manner. Thus, the localized endocytic trafficking of α5β1 within the tips of invasive pseudopods elicits signals that promote the reorganization of the actin cytoskeleton, protrusion, and invasion into FN-rich ECM.


Figures

Figure 1.
Figure 1.
RacGAP1 is a PKB/Akt substrate required for pseudopod extension and invasion. (A) A2780 cells expressing Akind on CDM were stimulated with 2.5 µM cRGDfV as indicated. Fluorescence lifetime images were captured, and representative lifetime maps are shown. FRET efficiency was calculated for ROI (dotted lines). The yellow line represents the baseline activity as determined by an inactive mutant of the probe. Bar, 10 µm (n > 18/condition). (B) PKB/Akt substrates were immunoprecipitated (IP) using anti-RxRxxS*/T* from lysates of EGF-stimulated cells treated with cRGDfV as indicated. IPs were separated by SDS-PAGE and analyzed by MS/MS. Hierarchical clustering of identified proteins is shown, with increasing abundance indicated by intensity. RacGAP1 is indicated with an asterisk. (C) Purified MBP-RacGAP1 was incubated in in vitro phosphorylation reactions as indicated. Proteins were separated by SDS-PAGE, protein loading was confirmed by Coomassie staining, and incorporation of radioactive ATP was measured by a phosphorimager. (D) Lysates of EGF-stimulated A2780 cells treated with cRGDfV and staurosporine as indicated were subjected to IP using anti-RxRxxS*/T* as in B or an isotype-matched control. IPs were analyzed by SDS-PAGE and Western blotting for RacGAP1 and quantified using the Odyssey system. Data represent means ± SEM from at least three independent experiments. *, P < 0.05; **, P < 0.001.
Figure 2.
Figure 2.
RacGAP1 is required for pseudopod extension and invasion. (A) A2780 cells were transfected with control or RacGAP1-specific SMARTpool oligonucleotides, seeded onto CDMs, and stimulated with cRGDfV as indicated. Images were captured every 10 min using a 20× objective lens. Representative images are shown. Bar, 50 µm. (B) Pseudopod length (n > 400/condition) was measured for all moving cells within the 20th frame. (C) A2780 cells were transfected as in A and seeded into inverted invasion assays after 16 h in the presence or absence of FN and cRGDfV as indicated. The yellow line indicates the level of invasion under control conditions. (D) A2780 cells stably expressing GFP or FLAG-RacGAP1WT were transfected with control or RacGAP RNAi oligo #6, treated as in C, and seeded into inverted invasion assays in the presence of cRGDfV and FN. (E) MDA-MB-231 cells were transfected as in A and seeded into inverted invasion assays in the presence of FN. (F) H1299 cells stably expressing mutant p53 (273H) or control vector (VEC) were transfected as in A and seeded into inverted invasion assays in the presence of FN. Data represent means ± SEM from at least three independent experiments. *, P < 0.05; **, P < 0.01; ***, P < 0.001.
Figure 3.
Figure 3.
RacGAP1 phosphorylation on T249 promotes association with IQGAP1. (A) Purified MBP-RacGAP1 and mutants were subjected to in vitro phosphorylation and incorporation of 33P measured as in Fig. 1 C. (B) PKB/Akt substrates were immunoprecipitated from lysates of A2780 cells stably expressing GFP, FLAG-RacGAP1, or FLAG-RacGAP1249A as in Fig. 1 D. (C) Lysates of A2780 cells stably expressing GFP(−), FLAG-RacGAP1, FLAG-RacGAP1249A, or FLAG-RacGAP1249D were subjected to IP using FLAG antibodies. IPs were analyzed by SDS-PAGE and Western blotting for FLAG, Ect2, and MKLP1. (D) Lysates of A2780 cells were subjected to IP using rabbit IQGAP1 antibodies or an isotype-matched control. IPs were analyzed by SDS-PAGE and Western blotting for RacGAP1 and IQGAP1. (E) Cells as in C were lysed, and IP was performed using rabbit IQGAP1 antibodies. IPs were analyzed by SDS-PAGE and Western blotting for FLAG and IQGAP1. (F) Western blots from IPs as in E were quantified using the Odyssey system. (G) Cells stably expressing GFP, FLAG-RacGAP1WT, or FLAG-RacGAP1249A on CDM were treated with cRGDfV for 1 h and fixed and stained with antibodies against FLAG and IQGAP1 before performing PLA. PLA signal was quantified by measuring the integrated density within the whole cell using ImageJ (n > 60/condition). Zoomed insets correspond to areas indicated by dotted ROIs. Bars, 20 µm. Data represent means ± SEM from at least three independent experiments. *, P < 0.05; **, P < 0.01; ***, P < 0.001.
Figure 4.
Figure 4.
IQGAP1 recruits RacGAP1 to the tips of invasive pseudopods as cells migrate in 3D. (A and B) A2780 cells were subjected to control or IQGAP1 #1 RNAi and seeded onto CDMs. Cells were stimulated with cRGDfV as indicated for 2 h before fixing and staining with rabbit anti-RacGAP1/anti–rabbit Cy2 antibodies and phalloidin–Texas red. (C) A2780 cells stably expressing GFP, FLAG-RacGAP1WT, FLAG-RacGAP1249A, or FLAG-RacGAP1249D on CDMs were stimulated with cRGDfV as indicated and fixed and stained with rabbit anti-IQGAP1/anti–rabbit Cy2 and mouse anti-FLAG/anti–mouse Cy3 antibodies. Images were captured using a spinning-disk confocal microscope, and representative pseudocolored images are shown. Zoomed insets correspond to areas indicated by dotted ROIs. Bars, 10 µm. Yellow arrows indicate direction of migration.
Figure 5.
Figure 5.
The RacGAP1–IQGAP1 complex promotes integrin-dependent invasive migration. (A) A2780 cells were subjected to control or IQGAP1 #1 RNAi and seeded onto CDMs. Images were captured, and pseudopod length was determined as in Fig. 2 (A and B; n > 100/condition). (B) A2780 cells were treated as in A and seeded into inverted invasion assays in the presence or absence of FN and cRGDfV as indicated. (C) A2780 cells stably expressing GFP, RacGAP1WT, RacGAP1249A, or RacGAP1249D were seeded onto CDMs and stimulated with cRGDfV as indicated, images were captured, and pseudopod length was measured as in Fig. 2 (A and B; n > 40/condition). (D) A2780 cells as in C were seeded into inverted invasion assays in the presence of FN and stimulated with cRGDfV as indicated. (E) A2780 cells stably expressing GFP, RacGAP1WT, or RacGAP1249D were transfected as in A and seeded into inverted invasion assays in the presence of FN and cRGDfV. Yellow lines indicate the level of invasion or pseudopod length under control conditions. Bars, 50 µm. Data represent means ± SEM from at least three independent experiments. *, P < 0.05; ***, P < 0.001.
Figure 6.
Figure 6.
Integrin trafficking suppresses Rac activity and activates RhoA. (A and B) A2780 cells expressing Raichu-Rac were seeded onto CDMs and stimulated with cRGDfV as indicated. Fluorescence lifetime images were captured at 1-min intervals, and representative lifetime maps are shown. (C) FRET efficiency was calculated for ROIs at the cell periphery at the front, middle (mean of the two sides), or back, from lifetime maps generated as in A and B (single images or means of all frames from time-lapse videos, n > 30/condition). (D) FRET efficiency at the cell front was calculated as in C (for each frame of time-lapse videos, n > 9/condition). (E and F) A2780 cells expressing Raichu-RhoA were analyzed as in A and B. (G) FRET efficiency was calculated as in C (n > 35/condition). (H) FRET efficiency at the cell front was calculated as in D (n > 15/condition). (I) H1299 cells stably expressing mutant p53 (273H) or control vector (VEC) were transfected with Raichu-Rac or Raichu-RhoA. FLIM was performed as in A and B, and FRET efficiency at the cell front was calculated as in C (n > 8/condition). (J) A2780 cells were transfected with control or RCP-specific siRNA and allowed to recover for 24 h. Cells were then transfected with Raichu-Rac or Raichu-RhoA. FLIM was performed as in A and B, and FRET efficiency at the cell front was calculated as in C (n > 13/condition). (K) A2780 cells expressing Raichu-RhoA were seeded onto CDMs and treated with vehicle or the Rac inhibitor NSC-23766 for 2 h. FLIM was performed as in A and B, and FRET efficiency at the cell front was calculated as in C (control, n = 8; NSC-23766, n = 10). Yellow lines represent the baseline activity as determined by an inactive mutant of the probe. Data represent means ± SEM from at least three independent experiments. *, P < 0.05; **, P < 0.01; ***, P < 0.001. Zoomed images from videos are shown in the time sequence and correspond to areas indicated by dotted ROIs. Bars, 10 µm.
Figure 7.
Figure 7.
Integrin trafficking suppresses Rac activity and activates RhoA through the RacGAP1–IQGAP1 complex. (A) A2780 cells were subjected to control or RacGAP1 oligo #6 RNAi and allowed to recover for 24 h. Cells were then transfected with Raichu-Rac or Raichu-RhoA as indicated and seeded onto CDM. FLIM was performed, and FRET efficiency at the cell front was calculated as in Fig. 6 (A–C; n ≥ 15/condition). (B) A2780 cells were subjected to control or IQGAP1 oligo #1 RNAi and allowed to recover for 24 h. Cells were then transfected with Raichu-Rac or Raichu-RhoA as indicated and seeded onto the CDM. FLIM was performed, and FRET efficiency at the cell front was calculated as in Fig. 6 (A–C; n ≥ 8/condition). (C) A2780 cells stably expressing RacGAP1WT, RacGAP1249A, or RacGAP1249D were transfected with Raichu-Rac and seeded onto CDMs. FLIM was performed, and FRET efficiency at the cell front was calculated as in Fig. 6 (A–C). Representative images are shown (n ≥ 8/condition). (D) A2780 cells stably expressing RacGAP1WT, RacGAP1249A, or RacGAP1249D were transfected with Raichu-RhoA and seeded onto CDMs. FLIM was performed, and FRET efficiency at the cell front was calculated as in Fig. 6 (A–C). Representative images are shown (n ≥ 4/condition). Zoomed insets correspond to areas indicated by dotted ROIs. Yellow lines represent the baseline activity as determined by an inactive mutant of the probe. Data represent means ± SEM from at least three independent experiments. *, P < 0.5; ***, P < 0.001. Bars, 10 µm.
Figure 8.
Figure 8.
Integrin trafficking promotes invasive migration through the suppression of Rac activity and activation of RhoA. (A) A2780 cells were subjected to control, Rac1, or RhoA SMARTpool RNAi and seeded onto CDMs after 24–36 h. Cells were stimulated with cRGDfV as indicated, and images were captured as in Fig. 2 A. Representative images are shown. Bar, 50 µm. (B–D) A2780 cells were cotransfected with GFP-Rac1 or GFP-RhoA (as indicated) alongside control, Rac1 #1, or RhoA #1 RNAi oligos and seeded onto CDM as in A, and images were captured as in Fig. 2 A. (B) Pseudopod length (>30 cells/condition) was measured as in Fig. 2 A. (C and D) Speed and persistence (≥26 cells/condition) of migration was analyzed using ImageJ. (E) A2780 cells were subjected to control, Rac1, or RhoA SMARTpool RNAi and seeded into inverted invasion assays in the presence of FN and cRGDfV. (F and G) MDA-MB-231 (F) or H1299-vector (VEC)/273H cells were subjected to control, Rac1, or RhoA SMARTpool RNAi and seeded into inverted invasion assays in the presence of FN. Data represent means ± SEM from at least three independent experiments. *, P < 0.05; **, P < 0.01; ***, P < 0.001.
Figure 9.
Figure 9.
RCP-dependent α5β1 trafficking promotes formation of actin spikes at the cell front and elongated movement in 3D matrix. (A) HT1080 and A2780 cells expressing Lifeact-mEGFP were plated onto CDM for 4 h before imaging. Actin dynamics were captured as cells move in 3D using a spinning-disk confocal microscope. Arrows indicate dynamic protrusions. Zoomed images from videos are shown in the time sequence and correspond to areas indicated by dotted ROIs. Bars, 20 µm. (B) Normalized actin density at protrusions was calculated by dividing the mean integrated density at protrusions by the mean integrated density within the whole cell (n > 500/condition). (C) A2780 cells were allowed to invade through a plug of collagen and FN for 24 h before fixation. Cells were stained for actin and imaged top to bottom using a confocal microscope. Maximum projections were produced using ImageJ, and the 3D reconstructions were made using Imaris. Bars, 50 µm. (D) The 2D shape descriptors were calculated from the maximum projections images, using the particle analysis plug-in of ImageJ (n > 46/condition). (E) The 3D shape descriptors were calculated from the entire cell volume, using the 3D shape plug-in of ImageJ (n > 46). Data represent means ± SEM from at least three independent experiments. ***, P > 0.01.
Figure 10.
Figure 10.
RCP-dependent α5β1 recycling regulates the localization of RacGAP1 and downstream signaling to RhoGTPases. (A) α5β1 trafficking is suppressed by αvβ3 or the transcriptional activity of p63, and Rac signaling predominates at the leading edge. (B) Inhibition of αvβ3 or expression of gain-of-function mutant p53 promotes the association of RCP with α5β1, recruitment of EGFR1, and subsequent recycling. Production of PA by DGK-α within the tips of pseudopods recruits RCP–α5β1/EGFR1 vesicles and localizes downstream signaling via PKB/Akt. Here, PKB/Akt phosphorylates RacGAP1, allowing its recruitment to IQGAP1, providing a platform for the inactivation of Rac and activation of RhoA to promote pseudopod extension and invasion in FN-rich ECM. P, phosphorylation.

References

    1. Bastos R.N., Penate X., Bates M., Hammond D., Barr F.A. 2012. CYK4 inhibits Rac1-dependent PAK1 and ARHGEF7 effector pathways during cytokinesis. J. Cell Biol. 198:865–880 10.1083/jcb.201204107 - DOI - PMC - PubMed
    1. Becker W. 2012. Fluorescence lifetime imaging—techniques and applications. J. Microsc. 247:119–136 10.1111/j.1365-2818.2012.03618.x - DOI - PubMed
    1. Brandt D.T., Baarlink C., Kitzing T.M., Kremmer E., Ivaska J., Nollau P., Grosse R. 2009. SCAI acts as a suppressor of cancer cell invasion through the transcriptional control of beta1-integrin. Nat. Cell Biol. 11:557–568 10.1038/ncb1862 - DOI - PubMed
    1. Bridgewater R.E., Norman J.C., Caswell P.T. 2012. Integrin trafficking at a glance. J. Cell Sci. 125:3695–3701 10.1242/jcs.095810 - DOI - PMC - PubMed
    1. Brown M.D., Sacks D.B. 2006. IQGAP1 in cellular signaling: bridging the GAP. Trends Cell Biol. 16:242–249 10.1016/j.tcb.2006.03.002 - DOI - PubMed

Publication types

MeSH terms