

Ovarian volume throughout life: a validated normative model
- PMID: 24019863
- PMCID: PMC3760857
- DOI: 10.1371/journal.pone.0071465
Ovarian volume throughout life: a validated normative model
Abstract
The measurement of ovarian volume has been shown to be a useful indirect indicator of the ovarian reserve in women of reproductive age, in the diagnosis and management of a number of disorders of puberty and adult reproductive function, and is under investigation as a screening tool for ovarian cancer. To date there is no normative model of ovarian volume throughout life. By searching the published literature for ovarian volume in healthy females, and using our own data from multiple sources (combined n=59,994) we have generated and robustly validated the first model of ovarian volume from conception to 82 years of age. This model shows that 69% of the variation in ovarian volume is due to age alone. We have shown that in the average case ovarian volume rises from 0.7 mL (95% CI 0.4-1.1 mL) at 2 years of age to a peak of 7.7 mL (95% CI 6.5-9.2 mL) at 20 years of age with a subsequent decline to about 2.8 mL (95% CI 2.7-2.9 mL) at the menopause and smaller volumes thereafter. Our model allows us to generate normal values and ranges for ovarian volume throughout life. This is the first validated normative model of ovarian volume from conception to old age; it will be of use in the diagnosis and management of a number of diverse gynaecological and reproductive conditions in females from birth to menopause and beyond.
Conflict of interest statement
Figures
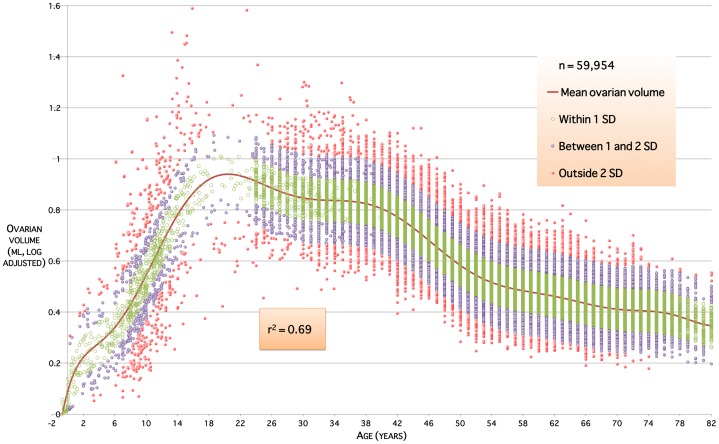
 coefficient of determination indicates that 69% of the variation in human ovarian volumes is due to age alone. Colour bands indicate ranges within
  standard deviation from mean, within
  and
and  standard deviations, and outside
  standard deviations.
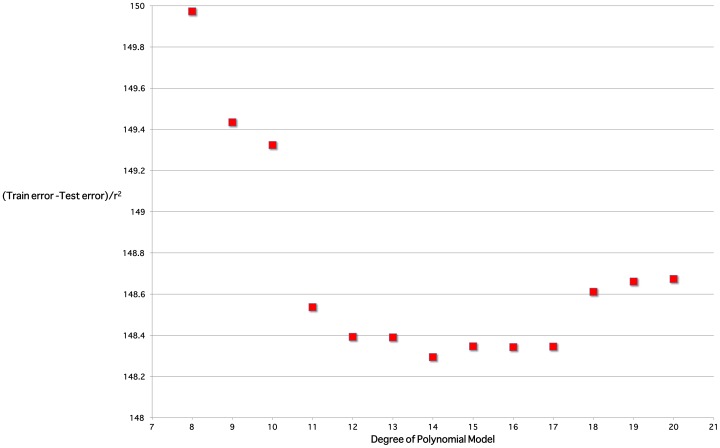
 ; models with degree greater than 17 are unsuitable due to larger differences between test and training mean-squared errors. The degree 14 model is optimal.
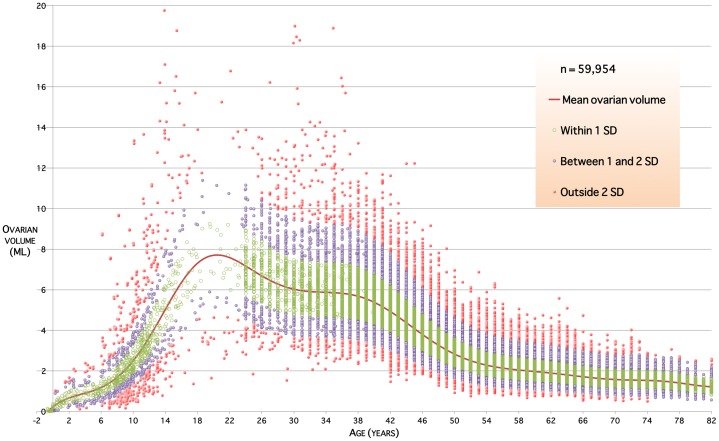
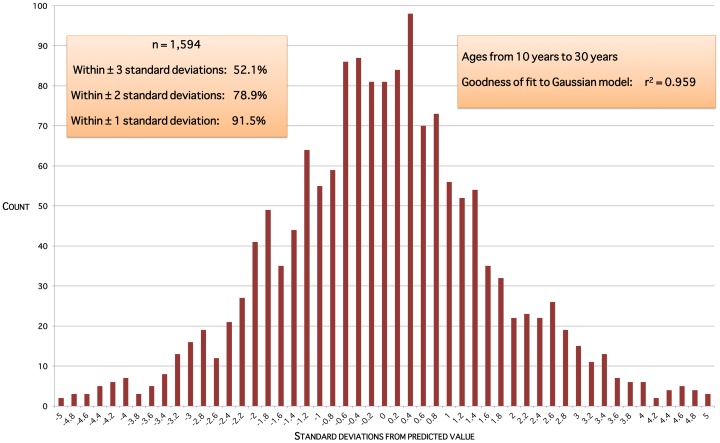
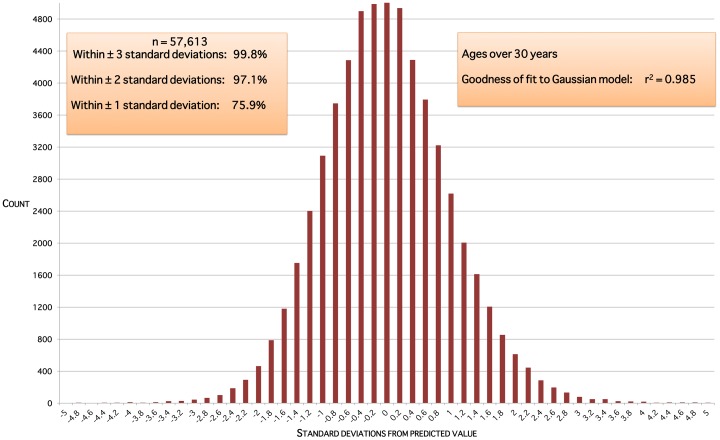
 standard deviation from mean, within
  and
and  standard deviations, and outside
  standard deviations.
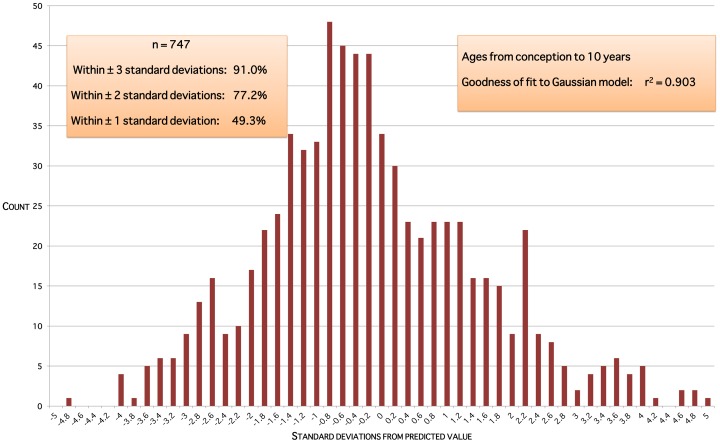
References
-
- Hansen KR, Knowlton NS, Thyer AC, Charleston JS, Soules MR, et al. (2008) A new model of reproductive aging: the decline in ovarian non-growing follicle number from birth to menopause. Human Reproduction 23: 699–708. - PubMed
-
- Faddy MJ, Gosden RG (1996) A model conforming the decline in follicle numbers to the age of menopause in women. Human Reproduction 11: 1484–6. - PubMed
-
- Treloar AE (1981) Menstrual cyclicity and the pre-menopause. Maturitas 3: 249–64. - PubMed
-
- van Noord PA, Dubas JS, Dorland M, Boersma H, te Velde E (1997) Age at natural menopause in a population-based screening cohort: the role of menarche, fecundity, and lifestyle factors. Fertility and Sterility 68: 95–102. - PubMed
Publication types
MeSH terms
Grants and funding
LinkOut - more resources
Full Text Sources
Other Literature Sources
Medical
