. 2013 Sep 3;8(9):e74763.
doi: 10.1371/journal.pone.0074763. eCollection 2013.

A forward genetic approach in Chlamydomonas reinhardtii as a strategy for exploring starch catabolism

Affiliations

A forward genetic approach in Chlamydomonas reinhardtii as a strategy for exploring starch catabolism

Hande Tunçay et al. PLoS One. .

Abstract

A screen was recently developed to study the mobilization of starch in the unicellular green alga Chlamydomonas reinhardtii. This screen relies on starch synthesis accumulation during nitrogen starvation followed by the supply of nitrogen and the switch to darkness. Hence multiple regulatory networks including those of nutrient starvation, cell cycle control and light to dark transitions are likely to impact the recovery of mutant candidates. In this paper we monitor the specificity of this mutant screen by characterizing the nature of the genes disrupted in the selected mutants. We show that one third of the mutants consisted of strains mutated in genes previously reported to be of paramount importance in starch catabolism such as those encoding β-amylases, the maltose export protein, and branching enzyme I. The other mutants were defective for previously uncharacterized functions some of which are likely to define novel proteins affecting starch mobilization in green algae.


Conflict of interest statement

Competing Interests: The authors have declared that no competing interests exist.

Figures

Figure 1
Figure 1. Two step iodine screen of putative starch catabolic mutants.
Cell patches of the wild-type strain 137C, two mutant strains defective for starch biosynthesis and of the three mutant classes are displayed after staining with iodine vapors. The cells were incubated 5 days under nitrogen starvation in the light (a) or one more day in the dark after the removal of the starvation (b). The wild-type reference 137C, the BafJ4 mutant strain lacking starch and the BafR1 mutant producing only amylopectin are shown at the top while the CAT1, 6, and 9 (second lane); the CAT17, 21, and 23 (third lane); the CAT 3, 19, and 22 (fourth lane) represent respectively mutants of the three classes.
Figure 2
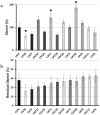
Figure 2. Starch deposition and kinetics of starch mobilization in class 1 mutants.
The amount of starch assayed in the strains after 5 days under nitrogen starvation (a) is displayed as a percentage of the value assayed in the wild-type reference strain 137C (21±4 µg per million cells) cultivated under the same conditions. The amount of starch remaining after 1 day of degradation of the same strains (b) is represented as the percentage of the initial amount measured in the corresponding strain. All data correspond to mean ±SE of three independent experiments. Significant differences with the wild-type 137C (p<0.05) are indicated with a star.
Figure 3
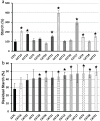
Figure 3. Starch deposition and kinetics of starch mobilization in class 2 mutants.
The amount of starch assayed in the strains after 5 days under nitrogen starvation (a) is displayed as a percentage of the value assayed in the wild-type reference strain 137C (21±4 µg per million cells) cultivated under the same conditions. The amount of starch remaining after 1 day of degradation of the same strains (b) is represented as the percentage of the initial amount measured in the corresponding strain. All data correspond to mean ±SE of three independent experiments. Significant differences with the wild-type 137C (p<0.05) are indicated with a star.
Figure 4
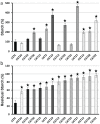
Figure 4. Starch deposition and kinetics of starch mobilization in class 3 mutants.
The amount of starch assayed in the strains after 5 days under nitrogen starvation (a) is displayed as a percentage of the value assayed in the wild-type reference strain 137C (21±4 µg per million cells) cultivated under the same conditions. The amount of starch remaining after 1 day of degradation of the same strains (b) is represented as the percentage of the initial amount measured in the corresponding strain. All data correspond to mean ±SE of three independent experiments. Significant differences with the wild-type 137C (p<0.05) are indicated with a star.
Figure 5
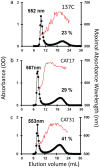
Figure 5. Separation of amylopectin and amylose by CL2B Sepharose chromatography.
The optical density (•) was measured for each 0.3-mL fraction at λmax (unbroken thin line). All samples were loaded on the same column setup described by . The wild-type haploid 137C strain starch extracted from nitrogen starved cultures (a) displays both amylopectin and low-molecular weight amylose. Starches from the mutant strains CAT17 and CAT31 are represented in b and c respectively. The amount of amylose (%) and the amylopectin λmax in nanometers are displayed on the corresponding graphs.
Figure 6
Figure 6. Partial purification of branching enzyme 1 activity.
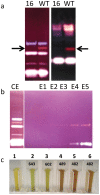
The enzymatic defect in the CAT 16 mutant can be observed through the lack of a pink or a red band (enlighted by arrows) on native (a; left panel) and denaturing (a; right panel) starch zymograms respectively. The lack of contaminating activities in the first elution fractions (E1 to E3) of the amylose column chromatography was assessed on starch denaturing zymogram (b). (c) Interaction of polysaccharides with iodine. Samples 1 to 6 correspond respectively to the iodine alone (1), the interaction of the latter with the unmodified amylose in the absence (2) or in the presence of the MOS in elution buffer (3). The iodine interaction of the polysaccharide modified by the enzyme contained in the 3 elution fractions are displayed in 4, 5 and 6. The values of the λmax of each complex is indicated on the figure in nanometers.
Figure 7
Figure 7. Molecular characterization of the CAT 16 mutant.
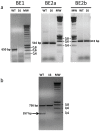
(a) Amplification of a part of each of the three branching enzyme structural genes was performed on genomic DNA extracted from the wild-type reference 137C (WT) and from the mutant (16). The amplification products sizes for the BE1, BE2a and BE2b structural genes were 650, 516 and 615 bp respectively. (b) RT-PCR analysis performed on total RNAs extracted from the wild-type and the CAT16 mutant allowing the amplification of a 736 bp fragment of the PHOB structural gene and a 357 bp fragment of the BE1 structural gene (indicated by an arrow). Smart ladder (Eurogentec) was used as molecular weight marker (MW), the standard fragments corresponding to 0.4, 0.6 and 0.8 kbp are indicated.

References

    1. Wilson WA, Roach PJ, Montero M, Baroja-Fernández E, Muñoz FJ, et al. (2010) Regulation of glycogen metabolism in yeast and bacteria. FEMS Microbiol Rev 34(6): 952–985. - PMC - PubMed
    1. Deschamps P, Moreau H, Worden AZ, Dauvillée D, Ball SG (2008) Early gene duplication within Chloroplastida and its correspondence with relocation of starch metabolism to chloroplasts. Genetics 178: 2373–2387. - PMC - PubMed
    1. Smith AM, Stitt M (2007) Coordination of carbon supply and plant growth. Plant Cell Environ 30: : 1126–1149. - PubMed
    1. Fincher GB (1989) Molecular and cellular biology associated with endosperm mobilization in germinating grain cereal grains. Annu Rev Plant Physiol Plant Mol Biol 40: 305–346.
    1. Razem FA, Davis AR (1999) Anatomical and ultrastructural changes of the floral nectary of Pisum sativum L during flower development. Protoplasma 206: 57–72.

Publication types

LinkOut - more resources