

State and national household concentrations of PM2.5 from solid cookfuel use: results from measurements and modeling in India for estimation of the global burden of disease
- PMID: 24020494
- PMCID: PMC3851863
- DOI: 10.1186/1476-069X-12-77
State and national household concentrations of PM2.5 from solid cookfuel use: results from measurements and modeling in India for estimation of the global burden of disease
Abstract
Background: Previous global burden of disease (GBD) estimates for household air pollution (HAP) from solid cookfuel use were based on categorical indicators of exposure. Recent progress in GBD methodologies that use integrated-exposure-response (IER) curves for combustion particles required the development of models to quantitatively estimate average HAP levels experienced by large populations. Such models can also serve to inform public health intervention efforts. Thus, we developed a model to estimate national household concentrations of PM2.5 from solid cookfuel use in India, together with estimates for 29 states.
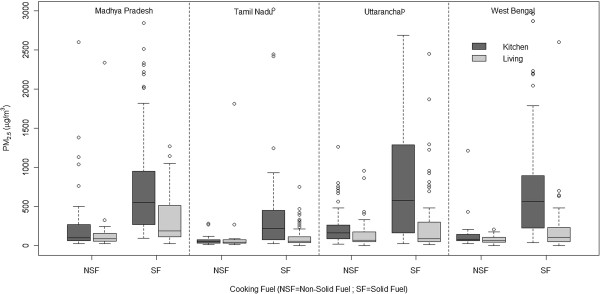
Methods: We monitored 24-hr household concentrations of PM2.5, in 617 rural households from 4 states in India on a cross-sectional basis between November 2004 and March 2005. We then, developed log-linear regression models that predict household concentrations as a function of multiple, independent household level variables available in national household surveys and generated national / state estimates using The Indian National Family and Health Survey (NFHS 2005).
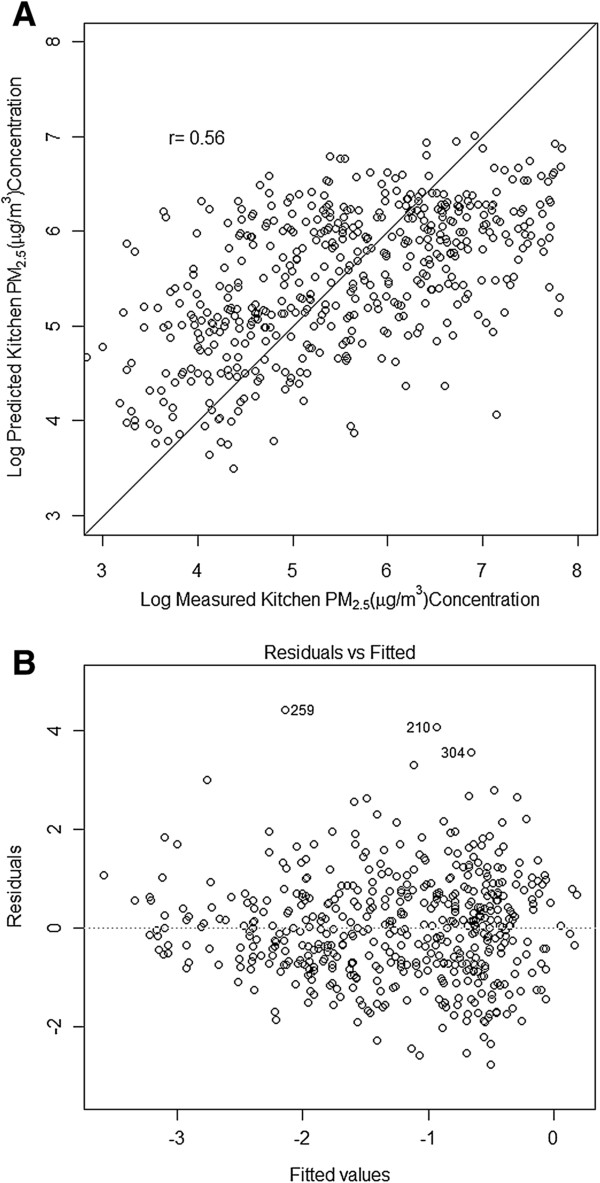
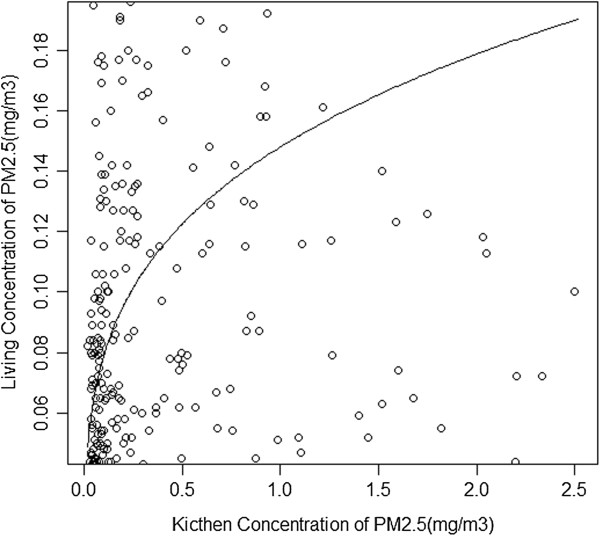
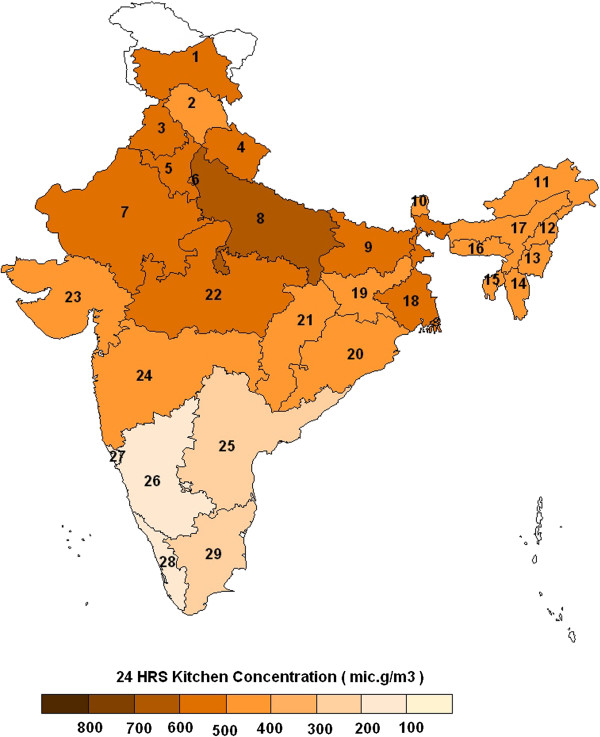
Results: The measured mean 24-hr concentration of PM2.5 in solid cookfuel using households ranged from 163 μg/m3 (95% CI: 143,183; median 106; IQR: 191) in the living area to 609 μg/m3 (95% CI: 547,671; median: 472; IQR: 734) in the kitchen area. Fuel type, kitchen type, ventilation, geographical location and cooking duration were found to be significant predictors of PM2.5 concentrations in the household model. k-fold cross validation showed a fair degree of correlation (r = 0.56) between modeled and measured values. Extrapolation of the household results by state to all solid cookfuel-using households in India, covered by NFHS 2005, resulted in a modeled estimate of 450 μg/m3 (95% CI: 318,640) and 113 μg/m3 (95% CI: 102,127) , for national average 24-hr PM2.5 concentrations in the kitchen and living areas respectively.
Conclusions: The model affords substantial improvement over commonly used exposure indicators such as "percent solid cookfuel use" in HAP disease burden assessments, by providing some of the first estimates of national average HAP levels experienced in India. Model estimates also add considerable strength of evidence for framing and implementation of intervention efforts at the state and national levels.
Figures
References
-
- Nations U. The Energy Access Situation in Developing Countries: A review focused on least 49 developed countries and sub-Saharan Africa. Kenya: Nairobi; 2009.
-
- Smith KR, Balakrishnan K, Butler C, Chafe Z, Fairlie I, Kinney P, Kjellstrom T, Mauzerall DL, McKone T, McMichael A, Schneider M. In: Global Energy Assessment - Toward a Sustainable Future. Johansson TB, Patwardhan A, Nakicenovic N, Gomez-Echeverri L, editor. New York: Cambridge University Press; 2012. From Energy and Health; pp. 255–324.
-
- Smith KR, Mehta S, Maeusezahl-Feuz M. In: Comparative Quantification of Health Risks: Global and Regional Burden of Disease Attributable to Selected Major Risk Factors. Ezzati M, Lopez AD, Rodgers A, Murray CJL, editor. Switzerland: World Health Organization; 2004. From Indoor air pollution from household use of solid cookfuels; pp. 1435–1494.
-
- Lim SS, Vos T, Flaxman AD, Danaei G, Shibuya K, Adair-Rohani H, Amann M, Anderson HR, Andrews KG, Aryee M, Atkinson C, Bacchus LJ, Bahalim AN, Balakrishnan K, Balmes J, Barker-Collo S, Baxter A, Bell ML, Blore JD, Blyth F, Bonner C, Borges G, Bourne R, Boussinesq M, Brauer M, Brooks P, Bruce NG, Brunekreef B, Bryan-Hancock C, Bucello C. et al.A comparative risk assessment of burden of disease and injury attributable to 67 risk factors and risk factor clusters in 21 regions, 1990–2010: a systematic analysis for the Global Burden of Disease Study. Lancet. 2012;380:2224–2260. doi: 10.1016/S0140-6736(12)61766-8. - DOI - PMC - PubMed
-
- The Global Indoor Air Pollution Database. http://www.who.int/indoorair/health_impacts/databases_iap/
Publication types
MeSH terms
Substances
LinkOut - more resources
Full Text Sources
Other Literature Sources
Medical
