. 2013:9:688.
doi: 10.1038/msb.2013.40.

A map of cell type-specific auxin responses

Affiliations

A map of cell type-specific auxin responses

Bastiaan O R Bargmann et al. Mol Syst Biol. 2013.

Abstract

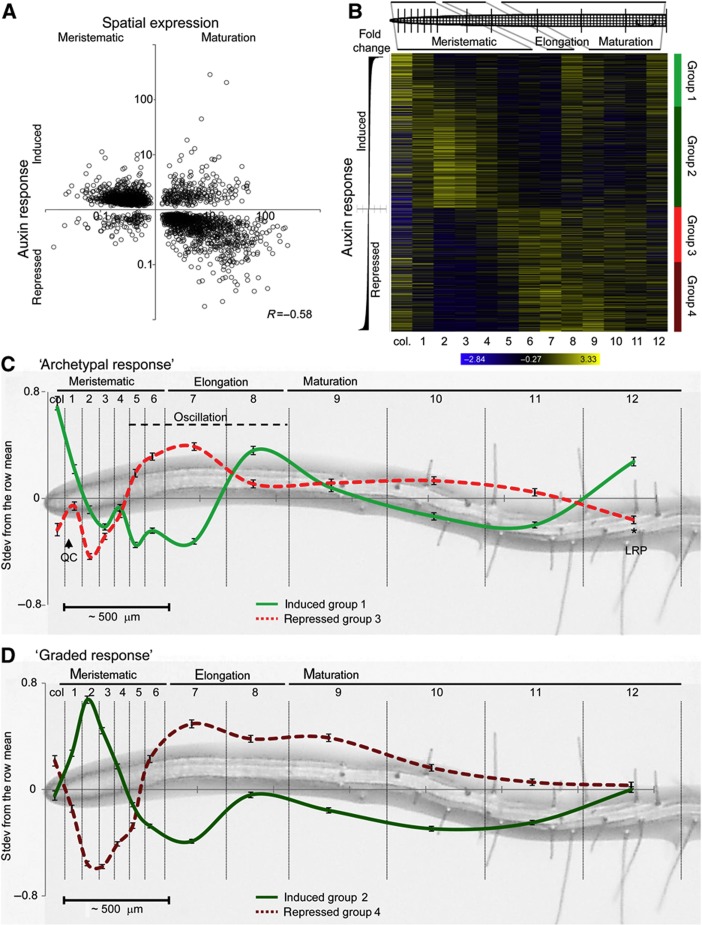
In plants, changes in local auxin concentrations can trigger a range of developmental processes as distinct tissues respond differently to the same auxin stimulus. However, little is known about how auxin is interpreted by individual cell types. We performed a transcriptomic analysis of responses to auxin within four distinct tissues of the Arabidopsis thaliana root and demonstrate that different cell types show competence for discrete responses. The majority of auxin-responsive genes displayed a spatial bias in their induction or repression. The novel data set was used to examine how auxin influences tissue-specific transcriptional regulation of cell-identity markers. Additionally, the data were used in combination with spatial expression maps of the root to plot a transcriptomic auxin-response gradient across the apical and basal meristem. The readout revealed a strong correlation for thousands of genes between the relative response to auxin and expression along the longitudinal axis of the root. This data set and comparative analysis provide a transcriptome-level spatial breakdown of the response to auxin within an organ where this hormone mediates many aspects of development.


Conflict of interest statement

The authors declare that they have no conflict of interest.

Figures

Figure 1
Figure 1
The Arabidopsis thaliana root apex. (A) The apex of the seedling root can be divided into the meristematic zone (consisting of the apical and basal meristem), elongation zone and maturation zone; shown here in a 5-day post germination (dpg) seedling root tip. The longitudinal transcriptomic data sampling sections gathered by Birnbaum et al (2003) and Brady et al (2007) are indicated. QC, quiescent center, scale bar indicates 1 mm. (B) Schematic representation of the cell types in longitudinal and radial cross-sections of the Arabidopsis root apical meristem.
Figure 2
Figure 2
Cell type-specific analysis of auxin responses. (A) Confocal micrographs of 5 dpg seedling roots of the four GFP-marker lines used for the fluorescence activated cell sorting of the stele (pWOL::GFP), xylem-pole pericycle (E3754), epidermis (and parts of the lateral root cap; pWER::GFP) and columella (PET111). Roots were incubated with propidium iodide to highlight cell boundaries (red); arrowheads indicate the QC, asterisk indicates the endodermis, scale bar indicates 50 μm. (B) A Venn diagram of the two-way ANOVA results showing the overlap between groups of genes found to be significant (P<0.01) for the factors cell type, treatment and interaction between cell type and treatment. (C) Venn diagram of the 3771 genes found to be significantly responding to auxin treatment in the four assayed tissues (t-test P<0.01, fold change >1.5). The yellow to red color code indicates percent overlap with auxin-responsive genes found in the analysis of intact roots. (D) Venn diagram of the overlap between lists of genes significantly regulated according to the ANOVA treatment or interaction factors (B) and the 3771 genes that pass any tissue-specific t-test (C). The blue-highlighted regions indicate genes in the ‘stringent’ list of 2846 auxin responders. (E) Micrograph of pLBD33::GUS reporter-gene line treated with auxin (5 μM IAA, 3 h), scale bar indicates 50 μm. (F) Histogram of microarray expression data for LBD33, showing significant induction specifically in the xylem-pole pericycle sample. Data are represented as mean±s.d.; n=3; t-test *P<0.05, **P<0.01. (G) Confocal analysis of pATHB-8::GFP reporter-gene line treated with auxin (1 μM 2,4-D, 16 h). Images were obtained with equal gain settings in the GFP channel. Arrowheads indicate the QC, arrows indicate the xylem pole, asterisks indicate endodermis and scale bars indicate 50 μm in longitudinal section and 25 μm in radial section. (H) Histogram of microarray expression data for ATHB-8, showing significant induction specifically in the stele sample. Data are represented as mean±s.d.; n=3, t-test ***P<0.001.
Figure 3
Figure 3
Categorizing cell type-specific auxin responses. (A) Spatial auxin-response patterns arranged by hierarchical clustering (pairwise Pearson’s correlation). 2846 genes significantly regulated in the ANOVA for treatment or for the interaction between treatment and cell type (P<0.01) and in at least one t-test of the four separate tissues assayed (P<0.01, fold change>1.5). The heatmap consists of row-normalized gene expression in rows and cell type±treatment in columns; blue (low) to yellow (high) color code indicates standard deviations from the row mean. (B) Dominant expression pattern 16 contains 148 genes with relatively uniform upregulation after auxin treatment; the GO term response to auxin stimulus is overrepresented in this list of genes (corrected Fisher’s exact test). (C) Dominant expression pattern 37 contains 137 genes that show high expression in the epidermis and are repressed by auxin treatment; the GO term trichoblast maturation is overrepresented in this list of genes (see Supplementary Figure S4 and Supplementary Table S3).
Figure 4
Figure 4
Auxin-responsive cell-identity markers. (A) Cell type-specifically enriched auxin-responsive genes show spatially distinct auxin responses. Heatmaps display the overlap between lists of cell type-specifically enriched genes (Supplementary Figure S2B; Supplementary Table S2) and the stringent list of 2846 auxin-responsive genes; blue (low) to yellow (high) color code indicates standard deviations from the row mean. Auxin-responsive developing-xylem-enriched genes (top panel) and QC-enriched genes (middle panel) are predominantly upregulated, specifically in the stele; auxin-responsive trichoblast-enriched genes (lower panel) are predominantly downregulated and highly expressed in the epidermis before treatment. (B) Boxplot representation of the fold-change distribution of maturing-xylem- (blue), xylem- (white) and developing-xylem- (yellow) enriched genes that significantly respond to auxin treatment in the stele (t-test P<0.01, all auxin-responsive genes in the stele are represented by a black box). Black circles represent minimum and maximum values, black lines represent the first and fourth quartiles, boxes represent the second and third quartiles, open circle represents the median; *P<1e−10 χ2-test for ratio of induced-to-repressed genes. (C) The S18 and S4 marker lines for maturing and developing xylem, respectively (left panel), were used to plot the fold change in expression upon auxin treatment in the stele versus the expression ratio between maturing and developing xylem for the 157 auxin-responsive (maturing and/or developing) xylem-enriched genes. Pearson’s correlation R=−0.58, scale bar indicates 250 μm.
Figure 5
Figure 5
Visualization of a global auxin-response gradient in the root meristem. (A) The fold-change response to auxin treatment (ANOVA treatment P<0.01, 5097 genes) was plotted versus the expression ratio between the meristematic zone and maturation zone (t-test P<0.01, 6850 genes; Supplementary Table S5; Birnbaum et al, 2003) for the genes that are both significantly responsive to auxin and significantly differentially expressed between meristematic and maturation zones (2437-gene intersect). Pearson’s correlation R=−0.58. (B) Heatmap of the spatial expression of auxin-responsive genes (ANOVA treatment P<0.01, 5097 genes) in the 13-slice longitudinal data set (root1; Brady et al, 2007). Genes were ordered by fold-change response to auxin treatment; blue (low) to yellow (high) color code indicates standard deviations from the row mean. Upregulated and downregulated genes were further subdivided into groups 1–4 based on relative induction or repression and broad differences in longitudinal expression (red and green color coding). (C, D) Average normalized longitudinal expression patterns of auxin-responsive genes, ±s.e.m. (groups 1–4 in B). The relative spatial separation of the 13-slice data set (Brady et al, 2007) is represented on the x axis and the standard deviations from the row mean on the y axis. (C) Longitudinal expression of archetypal auxin-responsive genes (groups 1 and 3 in B), consisting of the top 1000 induced and the first 1000 repressed genes. The quiescent center (QC), oscillation zone and first lateral root primordium (LRP) are indicated. (D) Longitudinal expression of graded auxin-responsive genes (groups 2 and 4 in B), consisting of the remaining 1842 induced and 1255 repressed genes.

References

    1. Bargmann BO, Birnbaum KD (2009) Positive fluorescent selection permits precise, rapid, and in-depth overexpression analysis in plant protoplasts. Plant Physiol 149: 1231–1239 - PMC - PubMed
    1. Bargmann BO, Birnbaum KD (2010) Fluorescence activated cell sorting of plant protoplasts. J Vis Exp 36: e1673, ; DOI: 10.3791/1673 - DOI - PMC - PubMed
    1. Benkova E, Michniewicz M, Sauer M, Teichmann T, Seifertova D, Jurgens G, Friml J (2003) Local, efflux-dependent auxin gradients as a common module for plant organ formation. Cell 115: 591–602 - PubMed
    1. Bennett T, Scheres B (2010) Root development-two meristems for the price of one? Curr Top Dev Biol 91: 67–102 - PubMed
    1. Bhalerao RP, Bennett MJ (2003) The case for morphogens in plants. Nat Cell Biol 5: 939–943 - PubMed

Publication types