. 2013 Oct 30;32(21):2790-803.
doi: 10.1038/emboj.2013.197. Epub 2013 Sep 10.

Differential proliferation rates generate patterns of mechanical tension that orient tissue growth

Affiliations

Differential proliferation rates generate patterns of mechanical tension that orient tissue growth

Yanlan Mao et al. EMBO J. .

Abstract

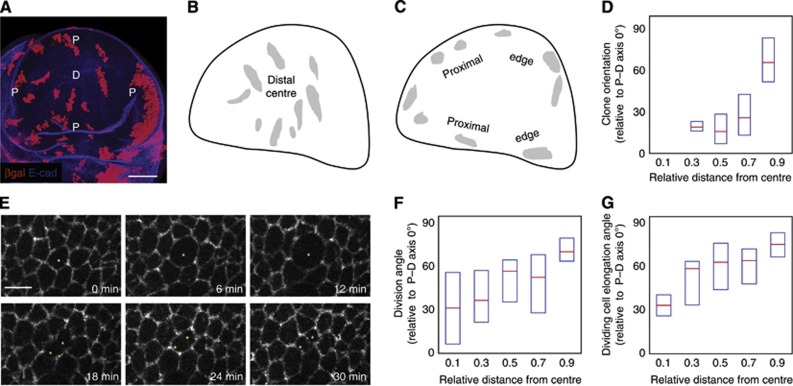
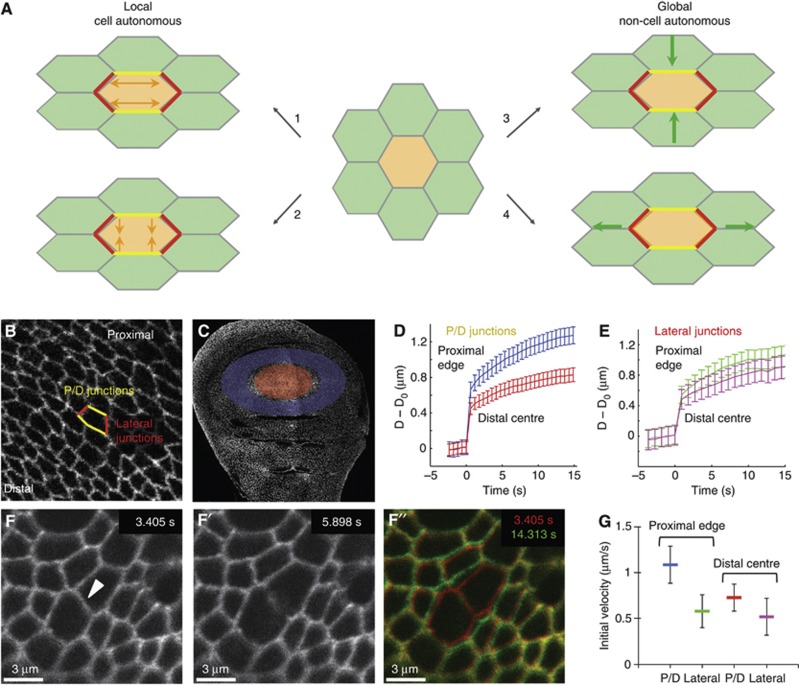
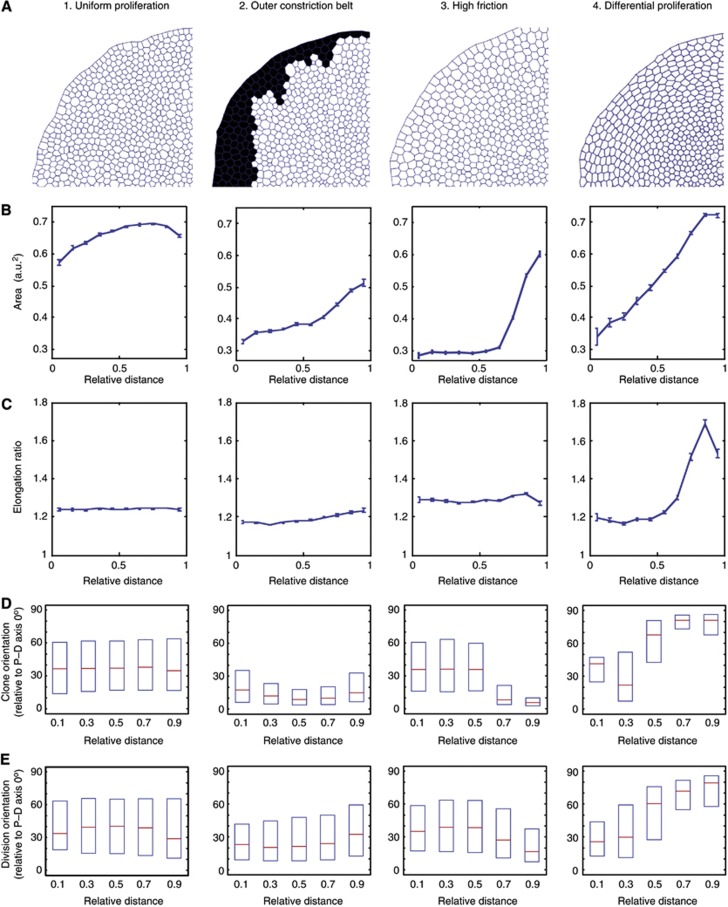
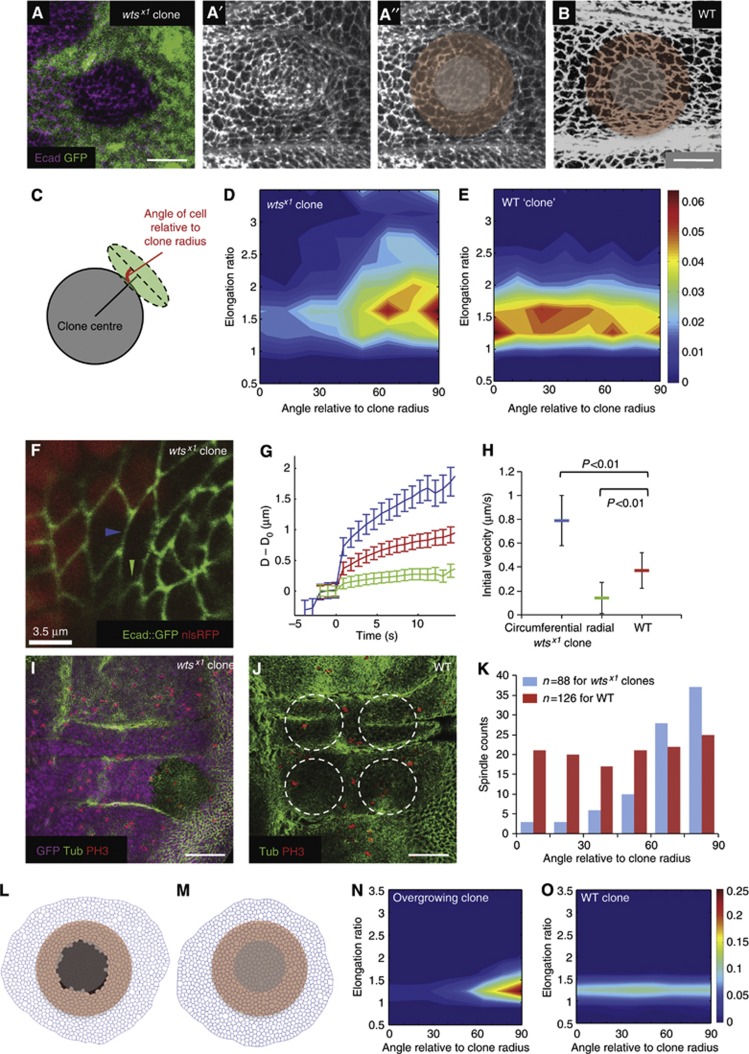
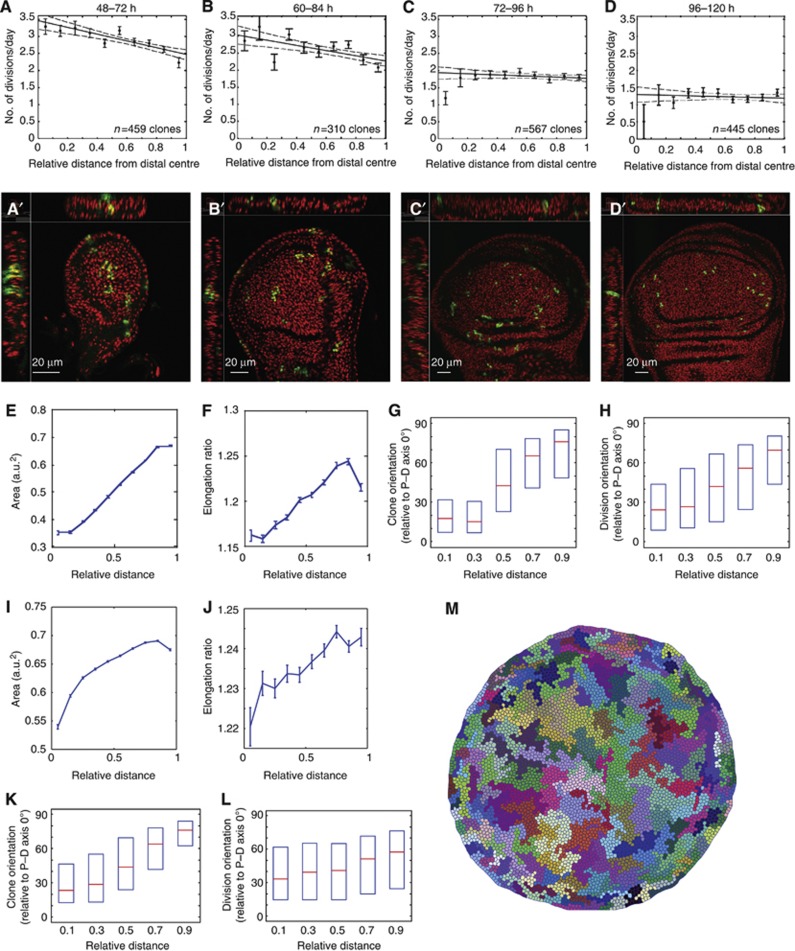
Orientation of cell divisions is a key mechanism of tissue morphogenesis. In the growing Drosophila wing imaginal disc epithelium, most of the cell divisions in the central wing pouch are oriented along the proximal-distal (P-D) axis by the Dachsous-Fat-Dachs planar polarity pathway. However, cells at the periphery of the wing pouch instead tend to orient their divisions perpendicular to the P-D axis despite strong Dachs polarization. Here, we show that these circumferential divisions are oriented by circumferential mechanical forces that influence cell shapes and thus orient the mitotic spindle. We propose that this circumferential pattern of force is not generated locally by polarized constriction of individual epithelial cells. Instead, these forces emerge as a global tension pattern that appears to originate from differential rates of cell proliferation within the wing pouch. Accordingly, we show that localized overgrowth is sufficient to induce neighbouring cell stretching and reorientation of cell division. Our results suggest that patterned rates of cell proliferation can influence tissue mechanics and thus determine the orientation of cell divisions and tissue shape.


Conflict of interest statement

The authors declare that they have no conflict of interest.

Figures

Figure 1
Figure 1
Clone orientations and division orientations change along the P–D axis. (A) A wild-type (WT) wing disc containing clones expressing lacZ. D marks the distal (centre) of the wing disc and P marks the proximal ring (edge); scale=50 μm. The P–D axis during wing disc development is a radial axis. (B) Overlay of clones in the distal (centre) region from several wing discs. These are elongated along the P–D axis (radial). (C) Overlay of clones in the proximal (edge) region from several wing discs. These are elongated perpendicular to the P–D axis (circumferential). (D) The long axes of individual clones are oriented relative to the P–D axis at that position (perfect P–D alignment=0°) and plotted against relative distance from the centre to the first fold (edge) of the wing pouch. Box plots show median and first and third quartiles, n=119 clones, only clones with an elongation ratio of >1.25 are plotted. (E) Snapshots from a live-imaged Arm::GFP wing disc, scale=5 μm. 0 min shows the dividing cell (marked by an asterisk) immediately prior to mitosis. At 30 min, cytokinesis has completed and the two daughter cells are formed. (F) The alignment of the two daughter cells immediately after mitosis in live-imaged discs is oriented relative to the P–D axis and plotted against its relative distance from the centre to the first fold of the pouch. Box plots show median and first and third quartiles, n=110 dividing cells. Only mother cells with elongation ratios (long/short axis)>1.3 are plotted. (G) The long axis of each dividing cell immediately prior to mitosis in live-imaged discs is oriented relative to the P–D axis and plotted against its relative distance from the centre to the first fold (edge) of the pouch. Box plots show median and first and third quartiles, n=110 dividing cells. Only cells with elongation ratios (long/short axis)>1.3 are plotted.
Figure 2
Figure 2
Wing disc development. Confocal micrographs of wing discs fixed at the indicated ages after egg laying (AEL). (A) Hoechst staining labels nuclei. Scale=100 μm. (B) Wing discs expressing E-cadherin::GFP at endogeneous levels, marking the adherens junctions to show the apical cell geometries. Scale=20 μm. Yellow ellipses mark the areas of wing discs used for analysis. For 48–72 h wing discs, the Nubbin expression domain is used (Supplementary Figure S2), for older wing discs, an elliptical zone up to the first visible fold is used. (C) A magnified view of the white-square region marked in (B), scale=4 μm. Note that folds in the surface of the wing disc appear at ∼80 h AEL.
Figure 3
Figure 3
Quantification of cell geometries in the developing wing disc. (A) The individual cell areas extracted from segmented images of fixed single wing pouches at the shown ages AEL. Scale=25 μm. (B) The individual cell elongation ratios extracted from the same wings as (A). Scale=25 μm. (CE) Averaged data from multiple wing discs: n=6 (48 h), n=12 (72 h), n=11 (84 h), n=12 (96 h), and n=10 (120 h). (C) Elongation orientation of cells averaged over a minimum of 10 cells. The length of the bar indicates the extent of elongation, and direction of the bar indicates orientation. (D) Mean apical area of cells plotted against its relative distance from the distal centre to the proximal edge of the pouch. Error bars indicate s.e.m. (E) Mean elongation ratios of cells plotted against its relative distance from the distal centre to the proximal edge of the pouch. Error bars indicate s.e.m.
Figure 4
Figure 4
Patterns of mechanical tension in the wing disc. (A) A schematic representation of the different mechanisms in which a cell (marked in orange) could elongate, starting from the isotropic configuration in the centre. (1) Local cell-autonomous extension of yellow junctions. (2) Local cell autonomous constriction of red junctions. (3) Global non cell-autonomous compression forces leading to constriction of the red junctions. (4) Global non cell-autonomous stretching forces leading to extension of yellow junctions. (B) In the wing disc, the junctions highlighted in yellow are the proximal/distal (P/D) junctions, and the junctions in red are the lateral junctions. The orientation of the wing disc is highlighted by the direction of the distal (centre) and the proximal (edge). (C) E-cadherin::GFP wing disc with the regions used for laser ablation in (D, E) highlighted. Red: distal centre, blue: proximal edge. (D) P/D junctions. Plot of increase in distance (μm) between the vertices of the cut junction (D−D0) against time (s) after laser cut, mean±s.e.m. Blue=P/D junctions in the proximal (edge) region. Red=P/D junctions in the distal (centre). (E) Lateral junctions, as in (D). Green=lateral junctions in the proximal (edge) region. Magenta=lateral junctions in the distal (centre). (FF′) Snapshots of an example laser ablation of a junction at the indicated time points (see Supplementary Movie 2). The cut was performed at 3.405 s and the recoil imaged for at least 15 s. (F″) An overlay of the junction before cut (red) and 11 s after cut (green) is shown. (G) The initial (maximum) recoil velocity of the vertices after the cut. Represented as mean±s.e.m. For cells at the proximal (edge) of the disc: P/D junctions (blue): velocity=1.09±0.20 μm/s, n=47; lateral junctions (green): velocity=0.58±0.18 μm/s, n=30. For cells at the distal centre: P/D junctions (red): velocity=0.73±0.16 μm/s, n=53; lateral junctions (magenta): velocity=0.52±0.2 μm/s, n=28. The average ratio of P/D to lateral junctions at the proximal edge is 1.87, higher than the average ratio of 1.4 at the distal centre of the pouch. Ablation experiments were performed at ∼100 h AEL.
Figure 5
Figure 5
Computational exploration of the different mechanisms that can generate global forces to elongate cells in the periphery of the disc. A radial (P–D) polarization of Dachs is applied to all simulations to mimic the in vivo Dachs polarization patterns. (A) Snapshots of a quadrant of the in silico wing discs after ‘60 h real time’ simulations (equivalent to between 2 and 10 h computational run time, depending on scenario). (BE) All graphs show relative distance from the centre of the disc on the X axis. (B) Cell area (arbitrary units) at end point. Error bars represent s.e.m. (C) Cell elongation ratios at end point. Error bars represent s.e.m. (D) Clones are induced in silico and their elongation orientations (relative to the radial P–D axis) are recorded at end point. Plots show median and first and third quartiles. Note the baseline bias of orientations towards the P–D axis, due to Dachs. (E) Cell division orientations are tracked throughout the run. Showing median and first and third quartiles. See Supplementary Figure S6 for detailed analysis of cell elongation orientations. The profile of the steep differential proliferation in mechanism (4) is shown in Supplementary Figure S6D, top panel.
Figure 6
Figure 6
The effect of altering proliferation rates in vivo. (AA″) wts mutant clones marked by lack of nuclear GFP and stained for E-cadherin in the hinge region of the wing disc, scale=10 μm. A more basal GFP section is used to show the nuclear GFP signal. (A″) Schematic to represent the grey mutant cells removed from the cell-shape analysis and the surrounding red cells used in the analysis in (D). (B) The hinge region of a wild-type wing disc stained for E-cadherin, scale=10 μm. The red region is the corresponding control cells used for cell-shape analysis in (E). (C) Scheme of how the cell shapes around the clones are quantified (see Materials and methods). (D) Cell-shape analysis of cells surrounding wts clones (n=5 clones). Majority of cells around the clone are elongated circumferentially around the clone (tangential). (E) Cell-shape analysis of cells surrounding WT ‘clones’ (n=5 clones, each in the corresponding regions to each wts mutant clone). Cells are less elongated and show no specific orientation patterns. (F) A wts mutant clone marked by the absence of nuclear RFP and simultaneously expressing an E-cadherin::GFP transgene to allow live imaging of cell junctions for laser ablation. The blue arrowhead marks a typical circumferential junction of a wild-type cell bordering the mutant clone that was cut for the analysis (see Supplementary Movie 7). The green arrowhead marks a typical radial junction as used in the analysis. (G) Plot of increase in distance (μm) between the vertices of the cut junction (D−D0) against time (s) after laser cut, mean±s.e.m. Blue=circumferential junctions of wild-type cells surrounding wts mutant tissue, green=radial junctions of wild-type cells surrounding wts mutant tissue, red=wild-type hinge junctions. (H) The initial (maximum) recoil velocity of the vertices after the cut. Represented as mean±s.e.m. For circumferential junctions surrounding wts mutant tissue (blue), velocity=0.79±0.21 μm/s, n=39 junctions; for radial junctions surrounding wts mutant tissue (green), velocity=0.14±0.13 μm/s, n=30 junctions; for WT hinge junctions (red), velocity=0.37±0.15 μm/s, n=50 junctions. (I) wts mutant clone (lack of GFP) stained for tubulin and PH3 to identify mitotic spindle orientation, scale=50 μm. Only spindles close to clone boundaries are used for analysis in K (see Materials and methods). (J) A WT wing disc stained for tubulin and PH3, scale=50 μm. Circles show typical control ‘clone’ regions used for WT hinge spindle analysis. (K) Spindles surrounding wts mutant clones (blue) are oriented more circumferentially around the clone (tangential), whereas spindles in WT hinges show no orientation bias. (L) In silico simulation of an acute overgrowing clone (black cells) in wild-type tissue. (M) Control simulation where there is no acute overgrowing clone. (N) Cells surrounding the overgrowing clone (pink cells in L) elongate perpendicular to the clone radius. (O) Without acute overgrowth, cells show no elongation bias around the ‘clone’.
Figure 7
Figure 7
Differential proliferation rates measured in vivo are sufficient to orient divisions and clonal growth. (AD) Proliferation rates (number of divisions/day) for the different 24 h developmental time windows are shown. Individual points are mean±s.e.m. Dotted lines show 95% confidence intervals of the fit of the proliferation profiles. (A′D′) An example of wing discs used for the proliferation rate analysis showing 3D views. Green=GFP expressing clones. Red=Hoechst stain for nuclei. (EH) Analysis of cell area, elongation ratio, clone orientation, and cell division orientations, when using a shallow differential proliferation for ‘60 h real time’ simulations. See Supplementary Figure S6E for proliferation profile used. This shallow profile is sufficient to produce the correct trends in cell behaviours as in vivo. (IM) Analysis of the ‘in vivo mimicking’ simulation. The exact spatial and temporal changes in proliferation profiles as measured in vivo are used for ‘72 h real time’ simulations. A uniform array of about 150 cells is used as the 48-h starting configuration (as in vivo; Figure 3). Clones are ‘induced’ at 48 h. Differential proliferation occurs until 84 h, followed by uniform proliferation, using the rates measured in (AD). Cell areas (I), cell elongation ratios (J), and clone orientations (K) at the end (120 h). Cell divisions throughout the run are tracked (L). Box plots show median and first and third quartiles. (M) Snapshot of the end point showing the pattern of clonal growth that closely matches that of in vivo clones.

Comment in

References

    1. Aegerter-Wilmsen T, Aegerter CM, Hafen E, Basler K (2007) Model for the regulation of size in the wing imaginal disc of Drosophila. Mech Dev 124: 318–326 - PubMed
    1. Aegerter-Wilmsen T, Heimlicher MB, Smith AC, de Reuille PB, Smith RS, Aegerter CM, Basler K (2012) Integrating force-sensing and signaling pathways in a model for the regulation of wing imaginal disc size. Development 139: 3221–3231 - PubMed
    1. Aegerter-Wilmsen T, Smith AC, Christen AJ, Aegerter CM, Hafen E, Basler K (2010) Exploring the effects of mechanical feedback on epithelial topology. Development 137: 499–506 - PubMed
    1. Aigouy B, Farhadifar R, Staple DB, Sagner A, Röper JC, Jülicher F, Eaton S (2010) Cell flow reorients the axis of planar polarity in the wing epithelium of Drosophila. Cell 142: 773–786 - PubMed
    1. Aliee M, Roper JC, Landsberg KP, Pentzold C, Widmann TJ, Julicher F, Dahmann C (2012) Physical mechanisms shaping the Drosophila dorsoventral compartment boundary. Curr Biol 22: 967–976 - PubMed

Publication types