Review
. 2013 Sep 9;14(9):18520-34.
doi: 10.3390/ijms140918520.

Differential polarization nonlinear optical microscopy with adaptive optics controlled multiplexed beams

Affiliations
Review

Differential polarization nonlinear optical microscopy with adaptive optics controlled multiplexed beams

Masood Samim et al. Int J Mol Sci. .

Abstract

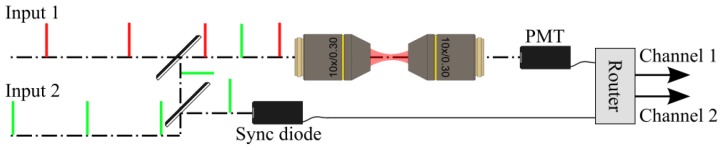
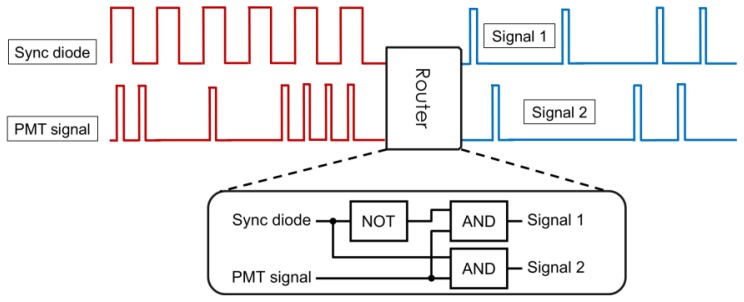
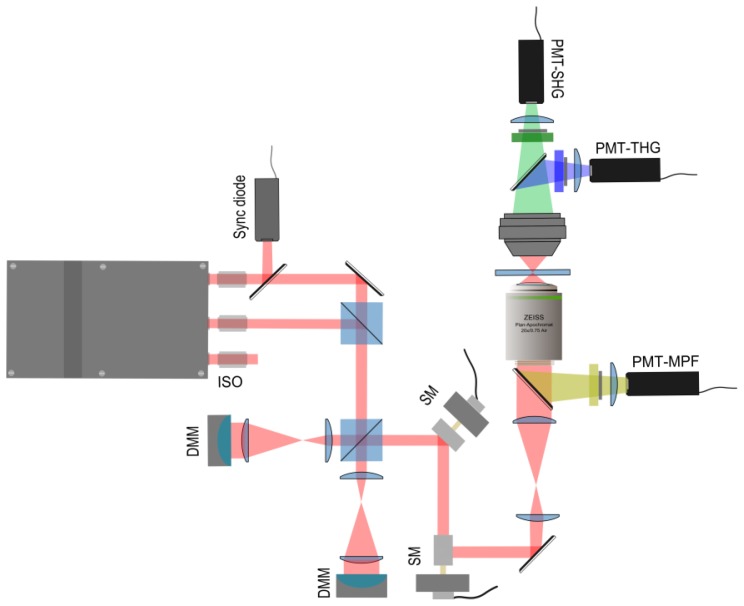
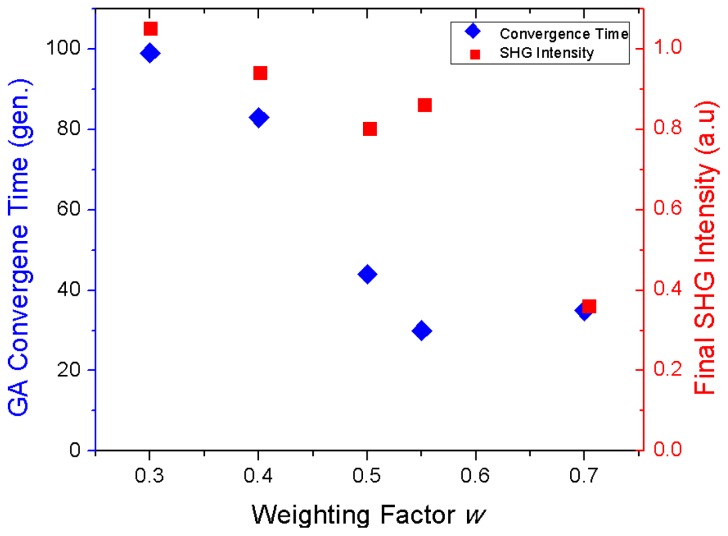
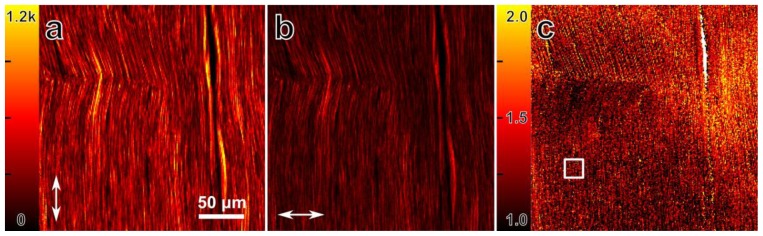
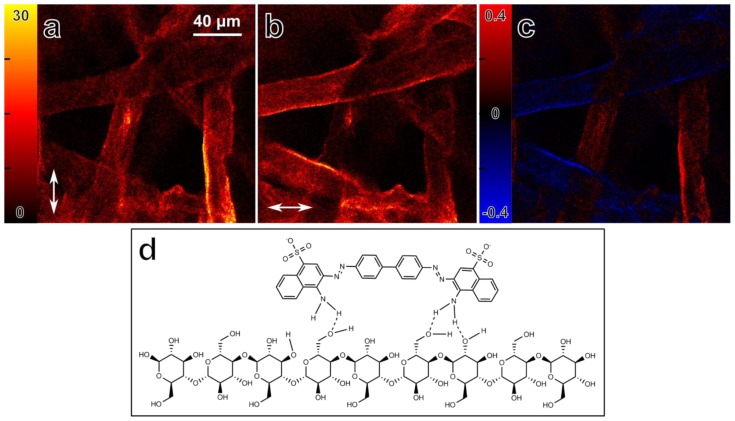
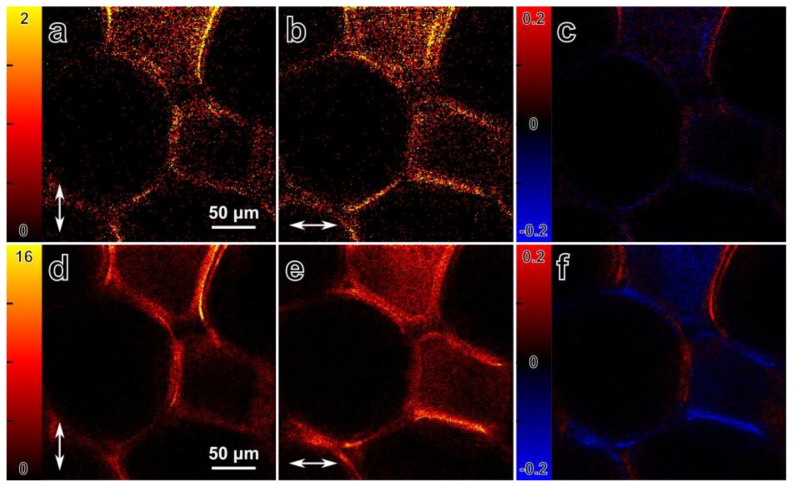
Differential polarization nonlinear optical microscopy has the potential to become an indispensable tool for structural investigations of ordered biological assemblies and microcrystalline aggregates. Their microscopic organization can be probed through fast and sensitive measurements of nonlinear optical signal anisotropy, which can be achieved with microscopic spatial resolution by using time-multiplexed pulsed laser beams with perpendicular polarization orientations and photon-counting detection electronics for signal demultiplexing. In addition, deformable membrane mirrors can be used to correct for optical aberrations in the microscope and simultaneously optimize beam overlap using a genetic algorithm. The beam overlap can be achieved with better accuracy than diffraction limited point-spread function, which allows to perform polarization-resolved measurements on the pixel-by-pixel basis. We describe a newly developed differential polarization microscope and present applications of the differential microscopy technique for structural studies of collagen and cellulose. Both, second harmonic generation, and fluorescence-detected nonlinear absorption anisotropy are used in these investigations. It is shown that the orientation and structural properties of the fibers in biological tissue can be deduced and that the orientation of fluorescent molecules (Congo Red), which label the fibers, can be determined. Differential polarization microscopy sidesteps common issues such as photobleaching and sample movement. Due to tens of megahertz alternating polarization of excitation pulses fast data acquisition can be conveniently applied to measure changes in the nonlinear signal anisotropy in dynamically changing in vivo structures.


Figures

Figure 1
Figure 1
Schematics of differential microscopy. Two excitation beams are multiplexed, and a synchronization signal is derived from one of the beams. The sample is subjected to the multiplexed excitation, and the signal from the PMT is separated by a router containing fast electronics.
Figure 2
Figure 2
Schematics of signal demultiplexing. The PMT signal is sorted into demultiplexed channels for each beam based on the signal from the synchronization diode. The router can be implemented directly in programmable counting cards, or as a separate unit consisting of fast electronic logic gates (inset).
Figure 3
Figure 3
Schematics of the multimodal differential nonlinear microscope. Two Yb:KGW laser beams are coupled into the microscope for multiplexed imaging, and deformable membrane mirrors are used to shape the wavefronts of each beam. The multiplexed beam is reflected from scanning mirrors and relayed to the excitation objective. SHG and THG signals are collected in the forward direction, and the fluorescence signal is detected in the epi-direction using PMT detectors. PMT—photomultiplier tube, ISO—optical isolator, DMM—deformable membrane mirror, SM—canning mirror.
Figure 4
Figure 4
THG signal intensity dependence on the full width at half maximum (FWHM) of the axial THG PSF. THG signal is generated across a glass-air interface of a microscope coverslip (open circles) and the FWHM of the axial PSF follows the theoretical curve (Equation 1, solid line; R2= 0.82). For our excitation objective (0.75 NA, λ = 1028 nm), the theoretical minimum limit of the axial THG PSF is 1.8 μm (dashed line) [25].
Figure 5
Figure 5
Dependence of the two GA optimization criteria on the value of the weighting factor w. The convergence time (blue diamonds, left y-axis) and final SHG intensity (red squares, right y-axis) are shown as a function of w for an initial separation distance of 6.3 ± 0.8 pixels (1.9 ± 0.2 μm). The optimum value for w appears to be around 0.55.
Figure 6
Figure 6
SHG polarization images from the stretched rat-tail tendon collagen sample used to determine ρ. (a,b) SHG images of the collagen sample with excitation polarization (indicated by the arrows) mostly parallel (a) and perpendicular; (b) to the fiber orientations; (c) The value of ρ for each pixel, calculated as ρ=I||/I. The white square indicates the area used to determine a value of 1.36 ± 0.01 for ρ.
Figure 7
Figure 7
Fluorescence detected nonlinear absorption anisotropy of Congo Red molecules bound to a filter paper (cellulose). (a,b) Fluorescence intensity images, obtained simultaneously with different laser polarizations. The arrows indicate the polarization direction; (c) Image of fluorescence detected absorption anisotropy, defined as r = (IVIH) / (IV + IH)max. Maximum absorption anisotropy occurs when one of the polarizations is parallel to the cellulose fibers; (d) Binding of Congo Red (top) to a cellulose molecule. Due to the symmetry of the Congo Red molecule, and many possible hydrogen bonding sites between cellulose and Congo Red, the diphenol backbone of the Congo Red molecule is likely to be parallel to the cellulose fiber orientation. Possible hydrogen bonds are indicated with dashed lines.
Figure 8
Figure 8
Multicontrast differential polarization imaging with SHG and fluorescence of Congo Red stained corn stalk tissue. (a,b) SHG intensity images, obtained simultaneously with orthogonal polarizations. The arrows indicate the polarization direction; (c) SHG anisotropy of the sample, defined as r = (IVIH) / (IV + IH)max ; (d,e) MPF intensity images obtained simultaneously with perpendicular polarizations. The arrows indicate the laser beam polarization direction; (f) Anisotropy of the fluorescence signal, defined as r = (IVIH) / (IV + IH)max. Maximum signal occurs when the polarization is parallel to the cellulose fibers.
Figure 9
Figure 9
Montage (Supplementary information) of SHG from a single ZnSe nanowire generated by the two perpendicularly polarized multiplexed beams during the GA-assisted beam overlapping procedure. Green: image from the stationary reference beam; red: image from the beam subjected to the GA. The weighting factor w was increased to 0.5 at the 9th generation. The overlapping process converged after 81 generations, which took approximately 5.5 min.

References

    1. Carpenter W.B., Smith F.G. The Microscope: And Its Revelations. Blanchard and Lea; Philadelphia, PA, USA: 1856.
    1. Hogg J. The microscope: Its history, construction, and applications. George Routledge and Sons; London, UK: 1867.
    1. Juang C.B., Finzi L., Bustamante C.J. Design and application of a computer-controlled confocal scanning differential polarization microscope. Rev. Sci. Instrum. 1988;59:2399–2408.
    1. Finzi L., Bustamante C., Garab G., Juang C.B. Direct observation of large chiral domains in chloroplast thylakoid membranes by differential polarization microscopy. Proc. Natl. Acad. Sci. USA. 1989;86:8748–8752. - PMC - PubMed
    1. Gorjanacz M., Torok I., Pomozi I., Garab G., Szlanka T., Kiss I., Mechler B.M. Domains of importin-alpha 2 required for ring canal assembly during drosophila oogenesis. J. Struct. Biol. 2006;154:27–41. - PubMed

Publication types

MeSH terms

LinkOut - more resources