. 2013 Nov;62(11):1697-1709.
doi: 10.1007/s00262-013-1473-z.

Expanded CD8+ T cells of murine and human CLL are driven into a senescent KLRG1+ effector memory phenotype

Expanded CD8+ T cells of murine and human CLL are driven into a senescent KLRG1+ effector memory phenotype

Joachim Rudolf Göthert et al. Cancer Immunol Immunother. 2013 Nov.

Abstract

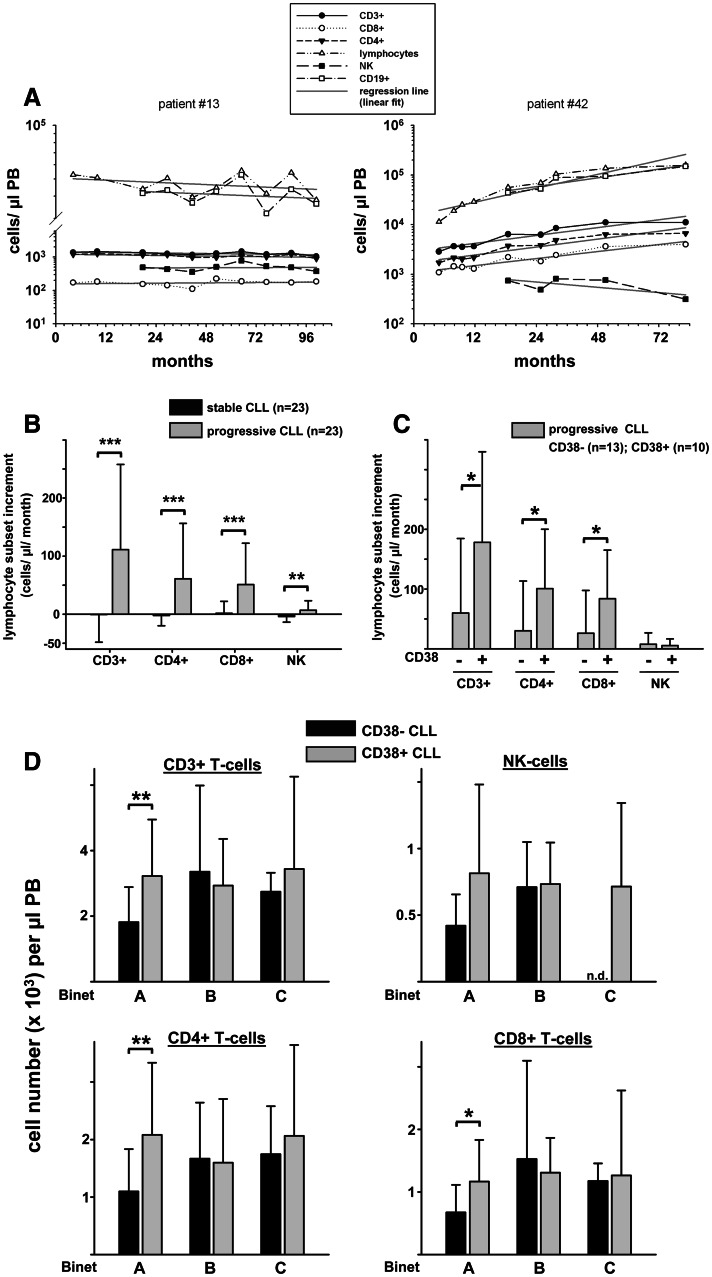
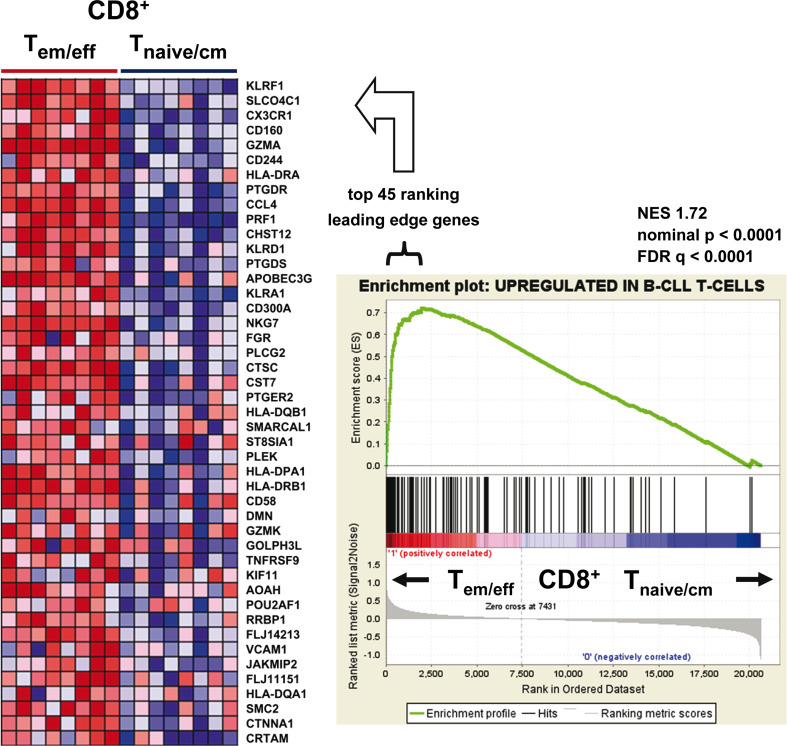
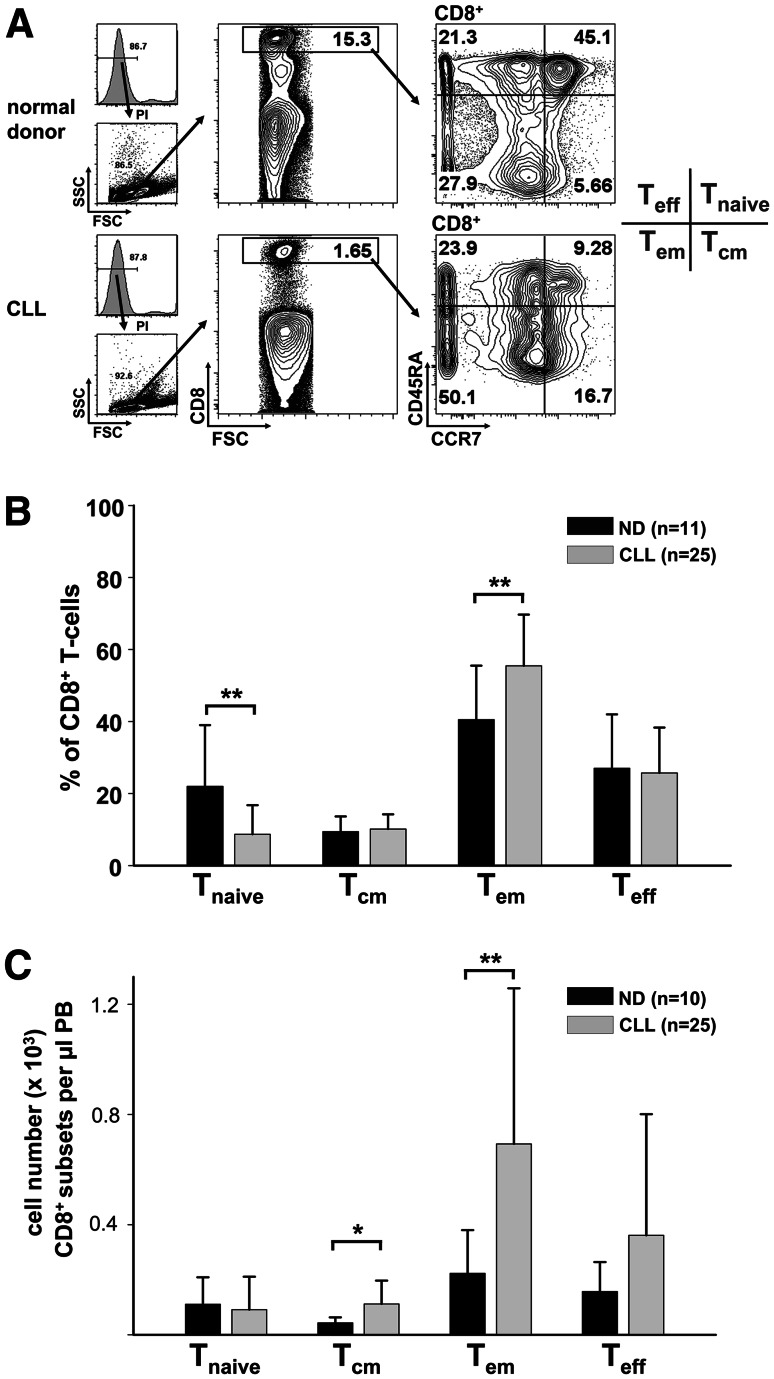
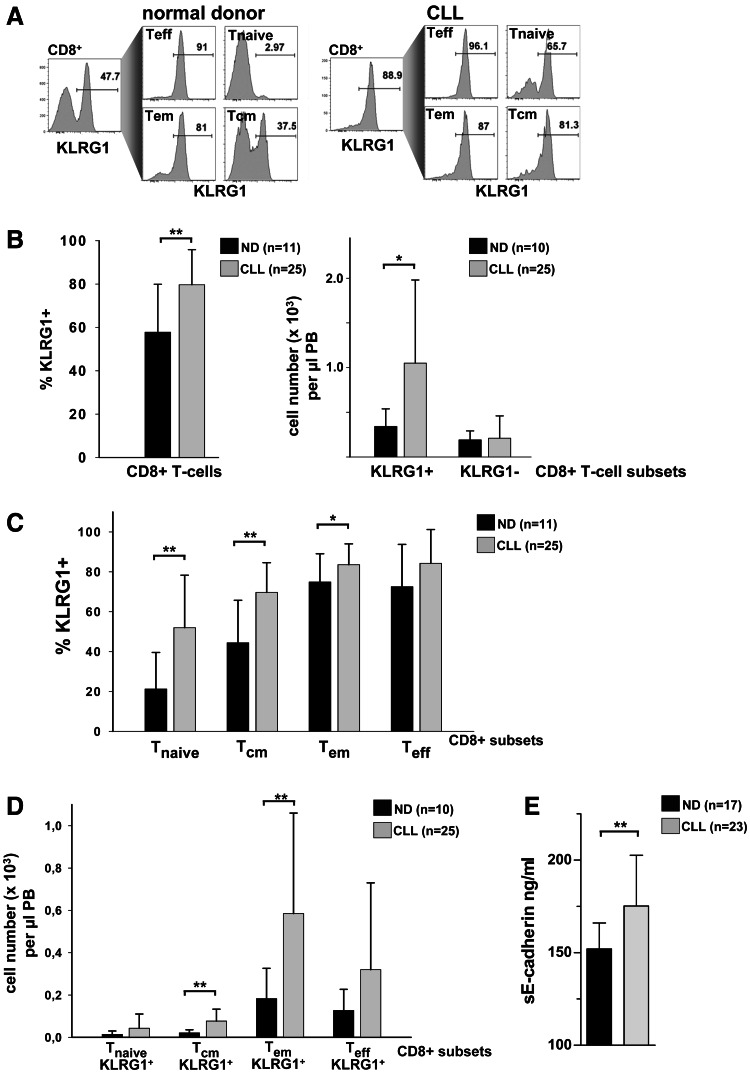
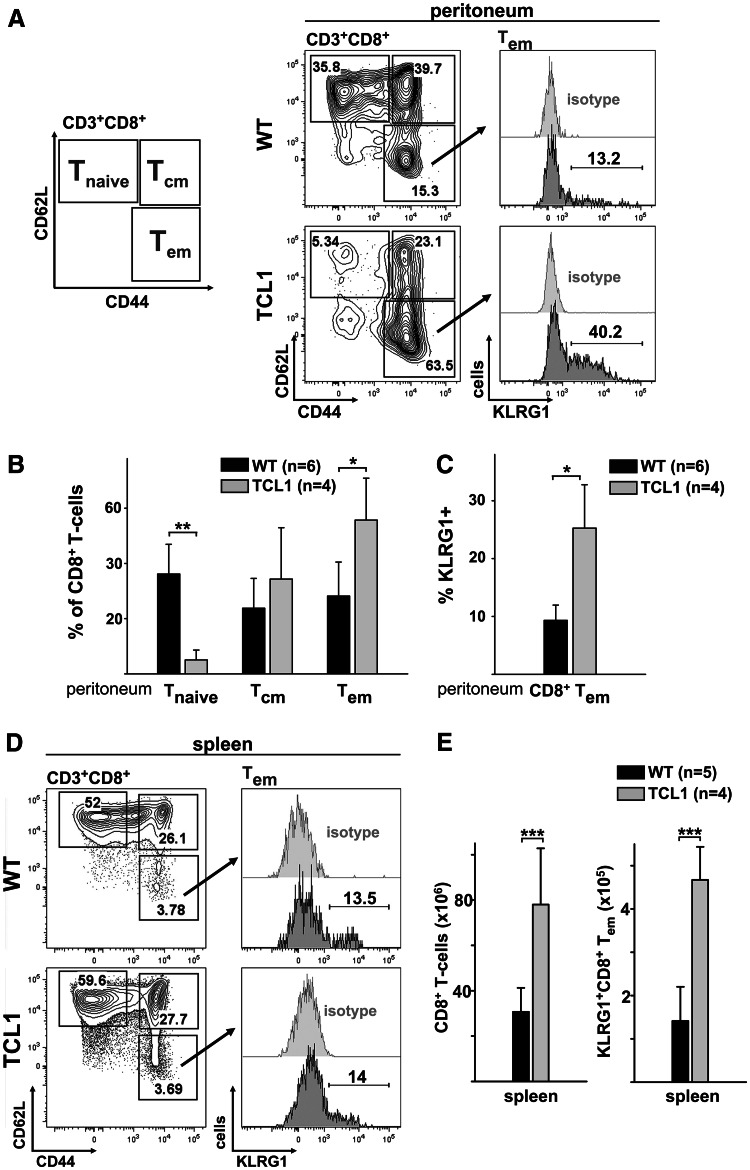
Altered numbers and functions of T cells have previously been demonstrated in chronic lymphocytic leukemia (CLL) patients. However, dynamics and specific T-cell subset alterations have not been studied in great detail. Therefore, we studied CLL blood lymphocyte subsets of individual patients in a longitudinal manner. Dynamic expansions of blood CD4 + and CD8 + T-cell numbers were consistently associated with a progressively increasing CLL leukemic compartment. Interestingly, the T-cell subset expansion over time was more pronounced in CD38 + CLL. Additionally, we performed gene expression profiling of CD3 + T cells of CLL patients and normal donors. Using gene set enrichment analysis, we found significant enrichment of genes with higher expression in CLL T cells within CD8+ effector memory and terminal effector T-cell gene signatures. In agreement with these data, we observed a marked expansion of phenotypic CD8 + effector memory T cells in CLL by flow cytometry. Moreover, we observed that increments of CD8 + effector memory T cells in human CLL and also mouse CLL (Eμ-TCL1 model) were due to an expansion of the inhibitory killer cell lectin-like receptor G1 (KLRG1) expressing cellular subset. Furthermore, higher plasma levels of the natural KLRG1 ligand E-cadherin were detected in CLL patients compared to normal donor controls. The predominance of KLRG1+ expression within CD8+ T cells in conjunction with increased systemic soluble E-cadherin might significantly contribute to CLL immune dysfunction and might additionally represent an important component of the CLL microenvironment.


Conflict of interest statement

The authors declare no competing financial interest.

Figures

Fig. 1
Fig. 1
Longitudinal kinetics of the accessory T-cell compartment in relation to disease progression and CD38 status. a Levels of total CD3+, CD8+ and CD4+ T cells, NK cells (defined as CD56+CD16+ cells), absolute lymphocytes and CD19+ B cells of individual CLL patients (n = 46) were determined over time. The slope of the regression line was determined for each lymphocyte subset of every patient. An increment of ≥500 lymphocytes/μl per month was arbitrarily defined as progressive disease (n = 23 patients). An increment <500 lymphocytes/μl per month was regarded as stable disease (n = 23 patients). Representative graphs of a patient with stable (left) and a patient with progressive disease (right) are shown. b Comparison of lymphocyte subset increments of stable and progressive disease patients. c Lymphocyte subset increments per month of CD38+ are significantly higher than increments of CD38 progressive CLL patients. d Absolute numbers of peripheral blood accessory lymphocyte subsets including CD3+ total T cells, CD4+ T cells, CD8+ T cells and NK cells were analyzed according to Binet stage and CD38 expression status. Subgroups: Binet A, CD38, n = 46; CD38+, n = 14; Binet B, CD38, n = 14, CD38+, n = 12; Binet C, CD38, n = 5; CD38+, n = 11. n.d., not determined; PB, peripheral blood; NK, natural killer cells. *P < 0.05; **P < 0.01; ***P < 0.001
Fig. 2
Fig. 2
Genes with higher expression in CLL T cells are significantly enriched within gene signatures of CD8+ effector memory and terminal effector T cells. Gene set enrichment analysis (GSEA) showing enrichment of genes with higher expression in CLL T cells in published gene signatures of sorted normal donor CD8+ effector memory (T em)/terminal effector (T eff) T-cell populations (n = 8) in comparison with those of sorted CD8+ naive (T naive)/central memory (T cm) T-cell populations (n = 8) [14]. The GSEA enrichment plot (right) and the heat map of the top ranking leading edge genes (left) are shown. In the GSEA plot, the x-axis represents the ranked list of genes from the highest to the lowest probe signal between T em/eff versus T naive/cm CD8+ T-cell populations. The black lines relate to the position of genes with higher expression in CLL T cells. The height of the green enrichment curve illustrates the degree of enrichment. A strong correlation was observed between normal donor T em/eff genes and the CLL T-cell gene signature. In the heat map (left), signal intensities of leading edge genes (left) are shown by shades of red (upregulation) and blue (downregulation). NES normalized enrichment score; FDR false discovery rate
Fig. 3
Fig. 3
The CD8+ effector memory T-cell compartment of CLL patients is expanded. a Peripheral blood mononuclear cells were stained with antibodies against CD8, CD45RA, CCR7 and with propidium iodide (PI). Subsets of CD8+ T cells were defined as naive (T naive; CD45RA+, CCR7+), central memory (T cm; CD45RA, CCR7+), effector memory (T em, CD45RA, CCR7) and terminal effector (T eff, CD45RA+,CCR7) cells. Representative plots of normal donor (ND) and CLL samples are shown. b Quantification of the flow cytometric CD8+ T-cell subset analysis. The relative proportion of naive CD8+ T cells is decreased, while the relative proportion of CD8+ T em cells is increased. c Absolute cell numbers of CLL CD8+ T cm and T em cells were increased. FSC forward scatter; SSC side scatter; PB peripheral blood. *P < 0.05; **P < 0.01
Fig. 4
Fig. 4
The high numbers of CD8+ T cells in CLL are due to an expansion of KLRG1+ cellular subsets. a KLRG1 expression within total CD8+ T cells and within CD8+ subsets according to the gating strategy depicted in Fig. 3 a. Representative plots of a normal donor and a CLL sample are shown. b The proportion of KLRG1+ cells within CD8+ T cells was compared between CLL patients and normal donor controls (left panel). Absolute numbers of KLRG1+CD8+ T cells were increased in the peripheral blood (PB) of CLL patients compared to normal donors (ND), while the numbers of KLRG1CD8+ cells did not differ between the two groups (right panel). c Significantly increased proportions of KLRG1+ cells were found in CD8+ T naïve, T cm and T em cell subsets. d KLRG1+CD8+ T cm and T eff cell numbers were significantly increased in CLL patients compared to normal donors. e CLL plasma levels of soluble E-cadherin (sE-cadherin), ligand of KLRG1, are increased compared to normal donors. ND normal donor.*P < 0.05; **P < 0.01
Fig. 5
Fig. 5
Peritoneal cavity and spleen CD8+ T cells of TCL1 transgenic mice are shifted toward a KLRG1+ effector memory phenotype. a Representative flow cytometric analysis of wild-type versus TCL1 peritoneal CD8+ T-cell subsets is displayed. Definition of murine CD8+ T-cell subsets: naïve (T naive: CD62L+, CD44low), central memory (T cm: CD62L+, CD44+) and effector memory (T em: CD62Llow, CD44+). Within the CD8+ T em compartment, KLRG1 expression was analyzed. b Compared to wild-type mice, the peritoneal CD8+ T-cell compartment of TCL1 transgenic mice was characterized by a decreased fraction of naive cells and an increased fraction of effector memory cells. c Within peritoneal TCL1 CD8+ T em compartment, the proportion of KLRG1+ cells was significantly increased. d Representative flow cytometric analysis of splenic CD8+ T-cell subsets. e TCL1 transgenic mice displayed a significant increase in CD8+ T-cell numbers (left). Significantly elevated KLRG1+CD8+ T em cell numbers were present in the spleens of TCL1 transgenic mice (right). *P < 0.05; **P < 0.01; ***P < 0.001. WT wild-type

References

    1. Chiorazzi N, Rai KR, Ferrarini M. Chronic lymphocytic leukemia. N Engl J Med. 2005;352(8):804–815. doi: 10.1056/NEJMra041720. - DOI - PubMed
    1. Bagnara D, Kaufman MS, Calissano C, Marsilio S, Patten PE, Simone R, Chum P, Yan XJ, Allen SL, Kolitz JE, Baskar S, Rader C, Mellstedt H, Rabbani H, Lee A, Gregersen PK, Rai KR, Chiorazzi N. A novel adoptive transfer model of chronic lymphocytic leukemia suggests a key role for T lymphocytes in the disease. Blood. 2011;117(20):5463–5472. doi: 10.1182/blood-2010-12-324210. - DOI - PMC - PubMed
    1. Burger JA, Ghia P, Rosenwald A, Caligaris-Cappio F. The microenvironment in mature B-cell malignancies: a target for new treatment strategies. Blood. 2009;114(16):3367–3375. doi: 10.1182/blood-2009-06-225326. - DOI - PMC - PubMed
    1. Mellstedt H, Choudhury A. T and B cells in B-chronic lymphocytic leukaemia: faust, Mephistopheles and the pact with the Devil. Cancer Immunol Immunother. 2006;55(2):210–220. doi: 10.1007/s00262-005-0675-4. - DOI - PMC - PubMed
    1. Gorgun G, Holderried TA, Zahrieh D, Neuberg D, Gribben JG. Chronic lymphocytic leukemia cells induce changes in gene expression of CD4 and CD8 T cells. J Clin Invest. 2005;115(7):1797–1805. doi: 10.1172/JCI24176. - DOI - PMC - PubMed

Publication types

MeSH terms

Associated data