. 2013:2013:262931.
doi: 10.1155/2013/262931. Epub 2013 Aug 19.

Scale-specific multifractal medical image analysis

Affiliations

Scale-specific multifractal medical image analysis

Boris Braverman et al. Comput Math Methods Med. 2013.

Abstract

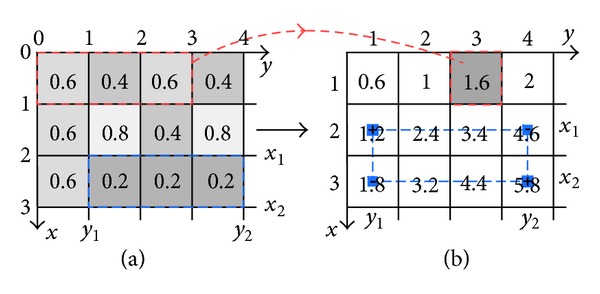
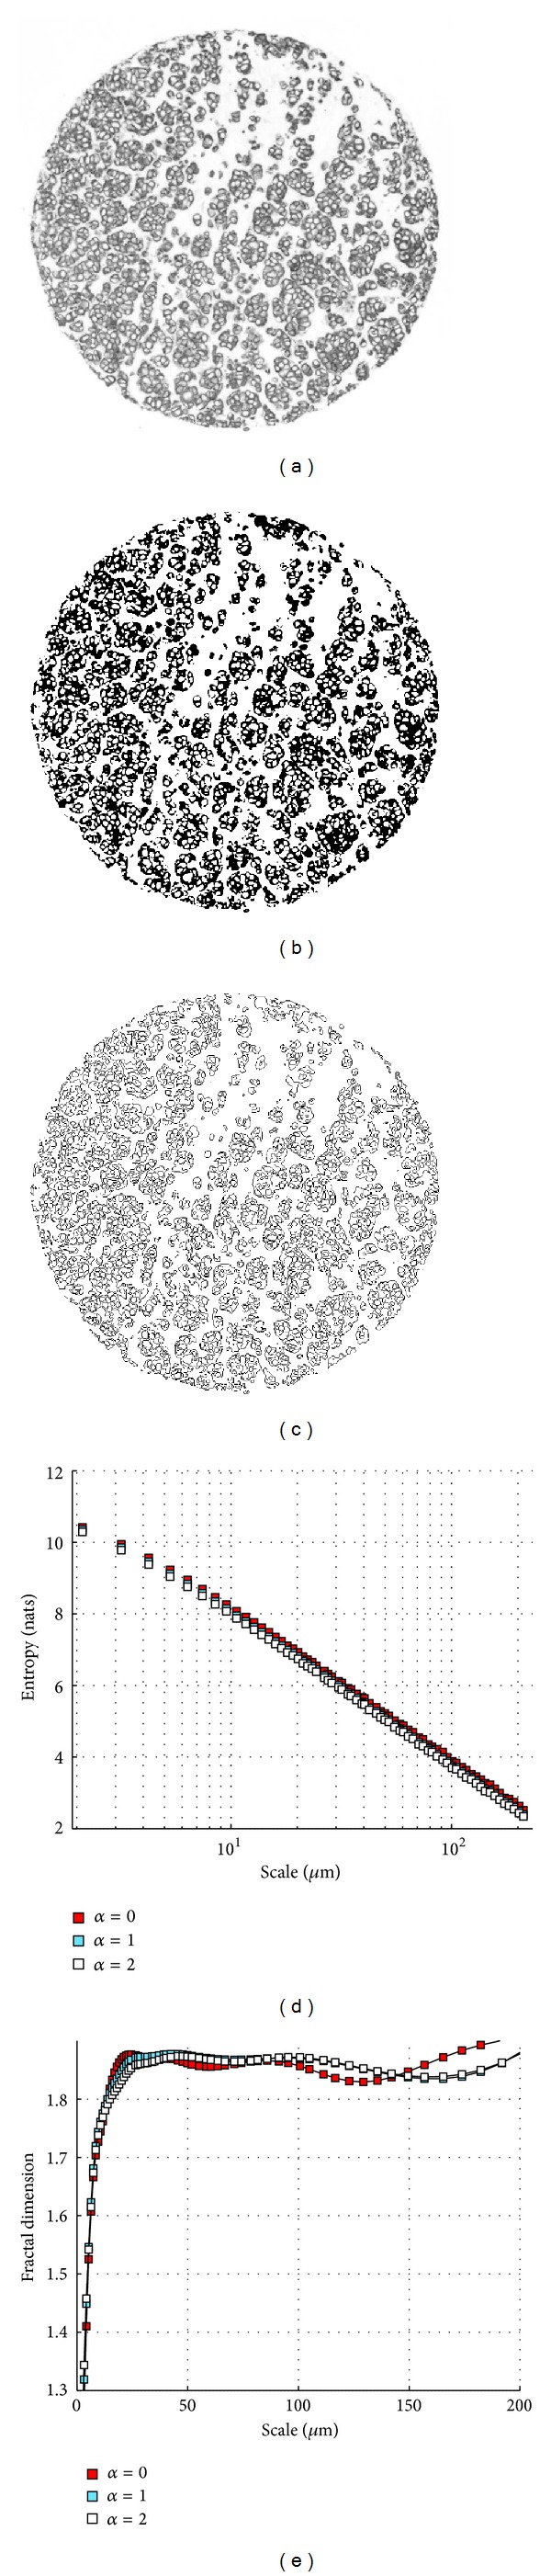
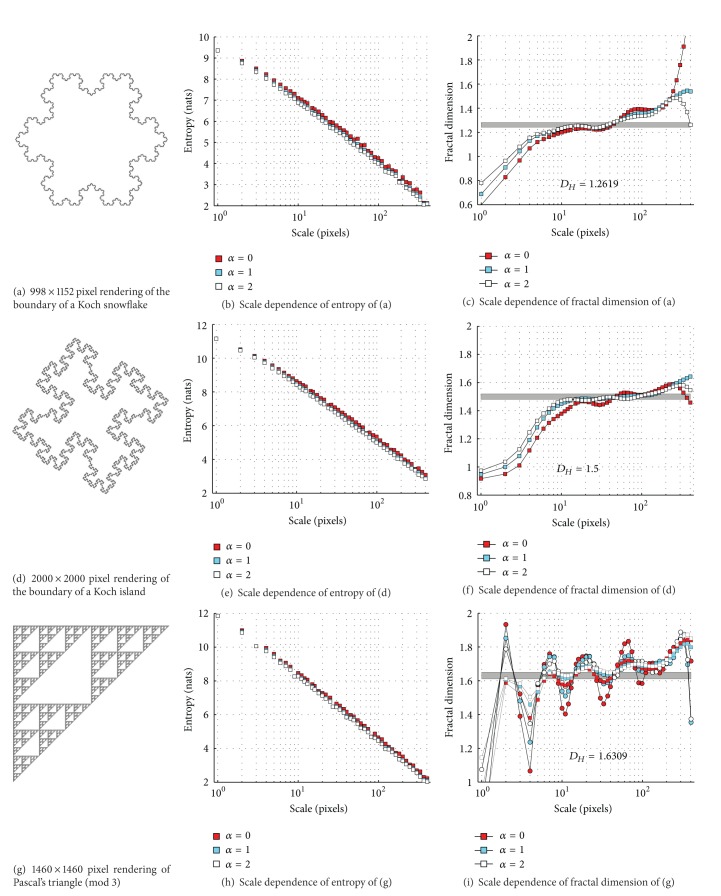
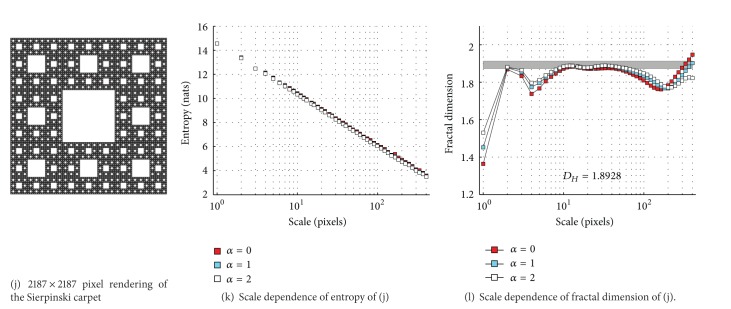
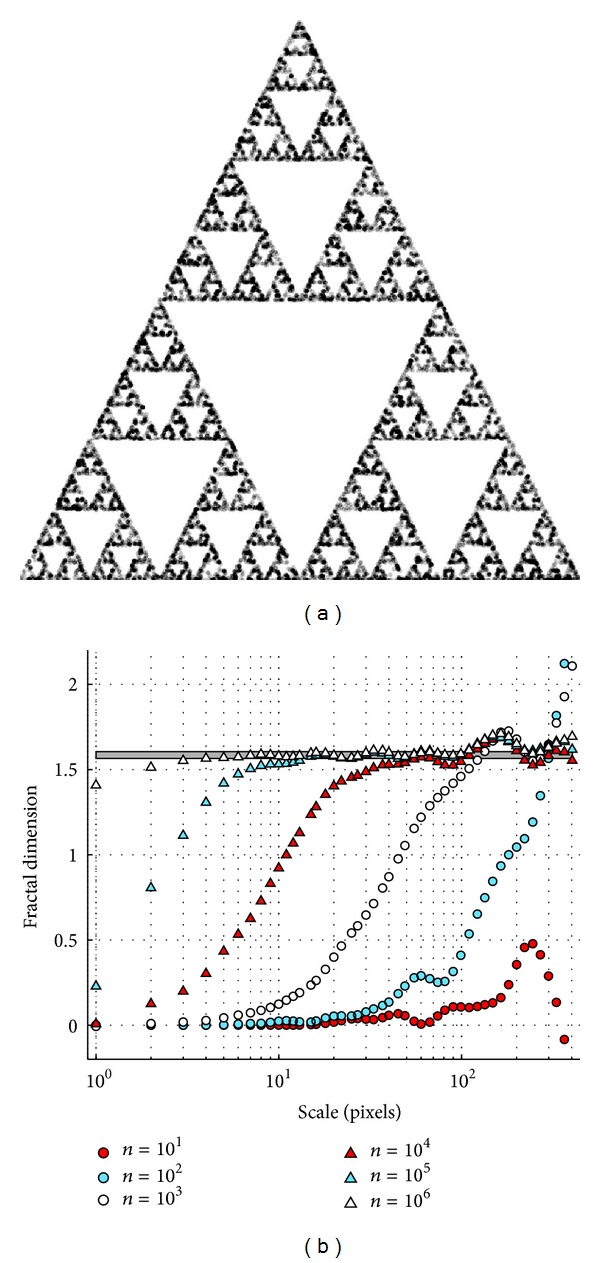
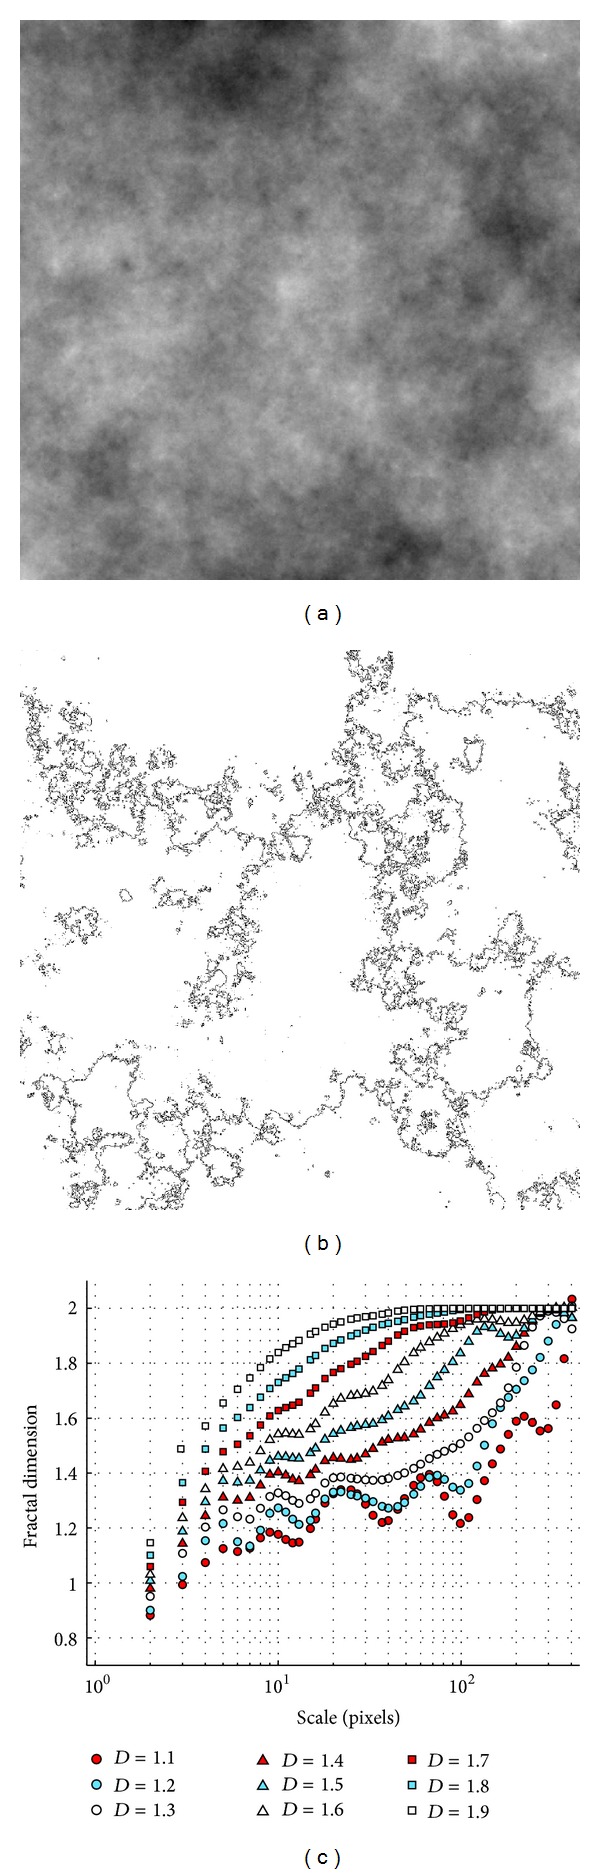
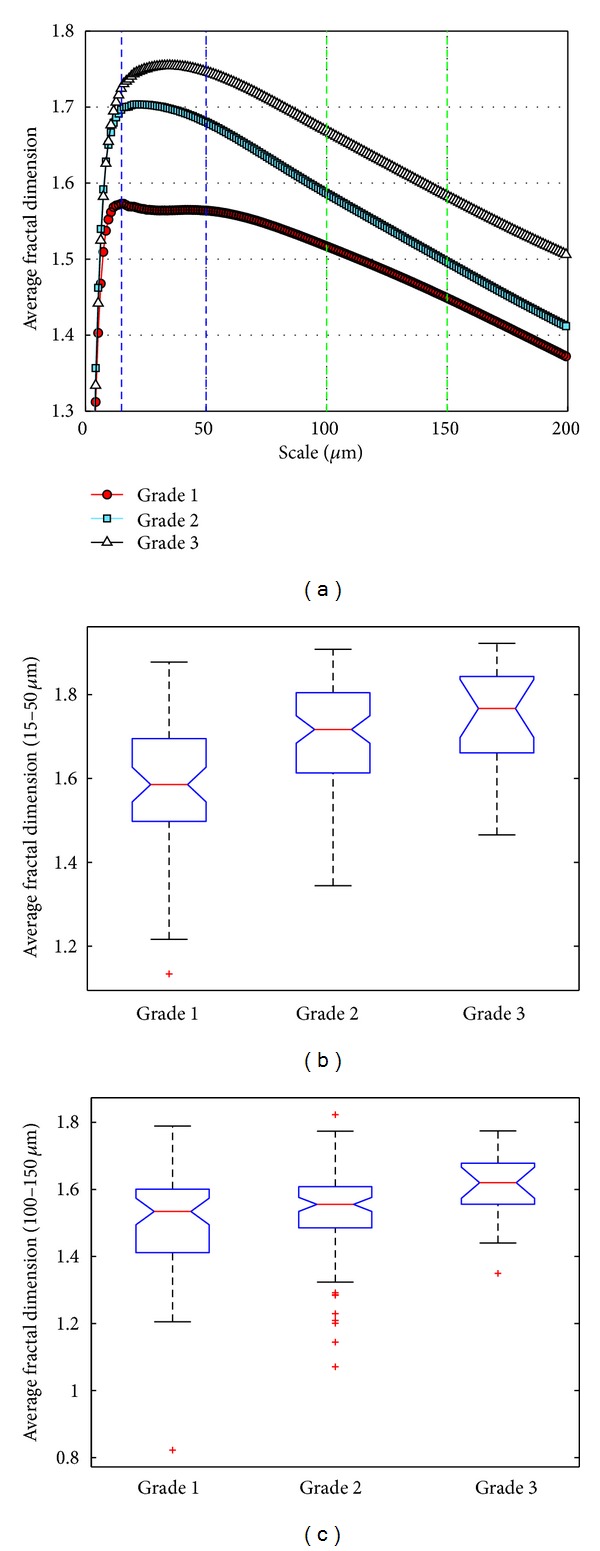
Fractal geometry has been applied widely in the analysis of medical images to characterize the irregular complex tissue structures that do not lend themselves to straightforward analysis with traditional Euclidean geometry. In this study, we treat the nonfractal behaviour of medical images over large-scale ranges by considering their box-counting fractal dimension as a scale-dependent parameter rather than a single number. We describe this approach in the context of the more generalized Rényi entropy, in which we can also compute the information and correlation dimensions of images. In addition, we describe and validate a computational improvement to box-counting fractal analysis. This improvement is based on integral images, which allows the speedup of any box-counting or similar fractal analysis algorithm, including estimation of scale-dependent dimensions. Finally, we applied our technique to images of invasive breast cancer tissue from 157 patients to show a relationship between the fractal analysis of these images over certain scale ranges and pathologic tumour grade (a standard prognosticator for breast cancer). Our approach is general and can be applied to any medical imaging application in which the complexity of pathological image structures may have clinical value.


Figures

Figure 1
Figure 1
An illustration of an intensity image (a) being summed to produce an integral image (b). The sum of the elements of (a) in the dotted red box gives the corresponding element of (b). After (b) is computed, the sum of the elements of (a) in the dashed blue box, with 2 < x < 3, 1 < y < 4, can be found by using (11). In this particular example, the sum equals 0.6, while B 3,4B 3,1B 2,4 + B 2,1 = 5.8 − 4.6 − 1.8 + 1.2 also equals 0.6.
Figure 2
Figure 2
An illustration of the overall analysis process. (a) Grayscale image of a breast tissue sample (600 μm in diameter). (b) Black and white thresholded version of (a). (c) Outlines of (b). (d) Image entropies determined from (c). (e) Scale-dependent fractal dimensions for this tissue sample.
Figure 3
Figure 3
Results of applying our algorithms to four renderings of mathematical fractals. The entropies in (b), (e), (h), and (k) are in nats, which are the natural units for information and entropy, with base e rather than 2: 1 nat ≈ 1.44 bits, and are plotted for α = 0,1, 2. All the fractal dimension plots (c), (f), (i), and (l) use σ = 0.5 in (6), except for (i) where σ = 0.3 for the circles. Horizontal bar indicates Hausdorff dimension D H of each mathematical fractal.
Figure 3
Figure 3
Results of applying our algorithms to four renderings of mathematical fractals. The entropies in (b), (e), (h), and (k) are in nats, which are the natural units for information and entropy, with base e rather than 2: 1 nat ≈ 1.44 bits, and are plotted for α = 0,1, 2. All the fractal dimension plots (c), (f), (i), and (l) use σ = 0.5 in (6), except for (i) where σ = 0.3 for the circles. Horizontal bar indicates Hausdorff dimension D H of each mathematical fractal.
Figure 4
Figure 4
(a) 2000 pixel × 2000 pixel rendering of a statistical Sierpinski triangle (104 points). Each point in the statistical fractal is rendered as a small grey disk for clarity. (b) Scale dependence of (box counting) fractal dimension of statistical Sierpinski triangles rendered with the indicated number of points (legend). The value σ = 0.3 is used in (6). Horizontal bar shows Hausdorff dimension D H = log⁡(3/2) ≈ 1.585.
Figure 5
Figure 5
(a) 1025 × 1025 pixel rendering of a Brownian surface of dimension 2.5. (b) Outlines of (a), which have a theoretical fractal dimension of 2.5 − 1 = 1.5. (c) Scale dependence of fractal dimension of (a) along with 8 other Brownian surfaces of different fractal dimensions. The theoretical dimensions of the outline images are indicated in the legend.
Figure 6
Figure 6
(a) Fractal dimensions of breast histology images (averaged over all images in each grade) as a function of the image scale. The two scale intervals (15–50 μm and 100–150 μm) used as examples are indicated by the vertical dashed lines. (b), (c) Boxplots of fractal dimensions in the scale interval 15–50 μm and 100–150 μm, respectively. See main text for statistical analysis.

References

    1. Mandelbrot BB. The Fractal Geometry of Nature. New York, NY, USA: W. H. Freeman; 1977.
    1. Coffey DS. Self-organization, complexity and chaos: the new biology for medicine. Nature Medicine. 1998;4(8):882–885. - PubMed
    1. Avnir D, Biham O, Lidar D, Malcai O. Is the geometry of nature fractal? Science. 1998;279(5347):39–40.
    1. Femat R, Alvarez-Ramirez J, Zarazua M. Chaotic behavior from a human biological signal. Physics Letters A. 1996;214(3-4):175–179.
    1. Espinoza-Valdez A, Ordaz-Salazar FC, Ugalde E, Femat R. Analysis of a model for the morphological structure of renal arterial tree: fractal structure. Journal of Applied Mathematics. 2013;2013:6 pages.396486

Publication types

LinkOut - more resources