

Adaptation of maize to temperate climates: mid-density genome-wide association genetics and diversity patterns reveal key genomic regions, with a major contribution of the Vgt2 (ZCN8) locus
- PMID: 24023610
- PMCID: PMC3758321
- DOI: 10.1371/journal.pone.0071377
Adaptation of maize to temperate climates: mid-density genome-wide association genetics and diversity patterns reveal key genomic regions, with a major contribution of the Vgt2 (ZCN8) locus
Abstract
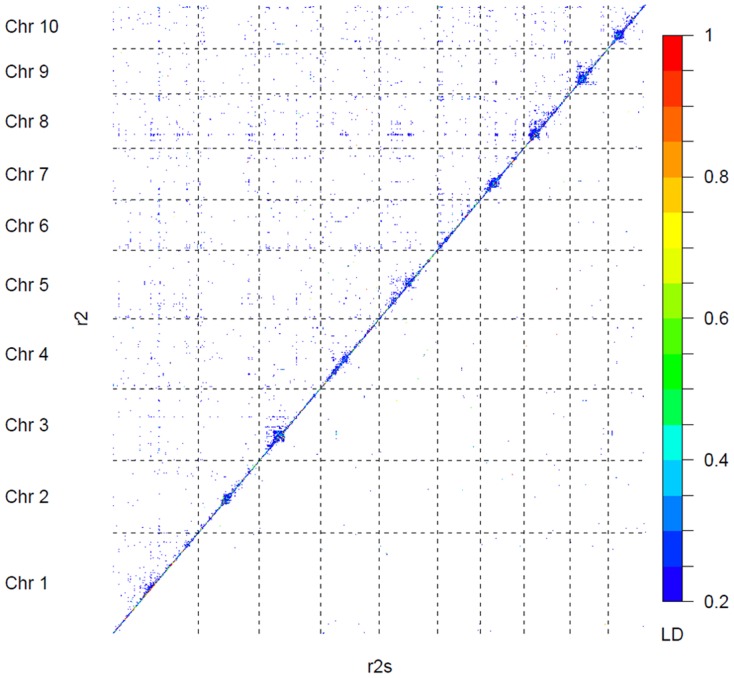
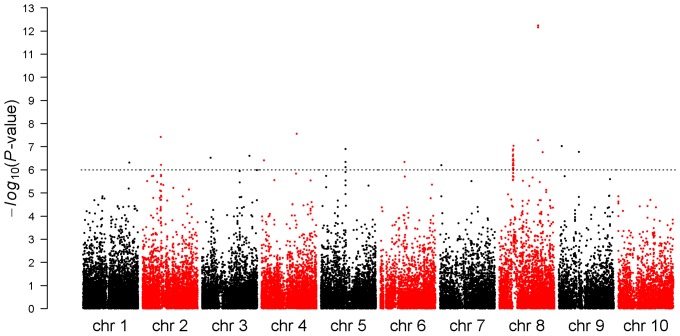
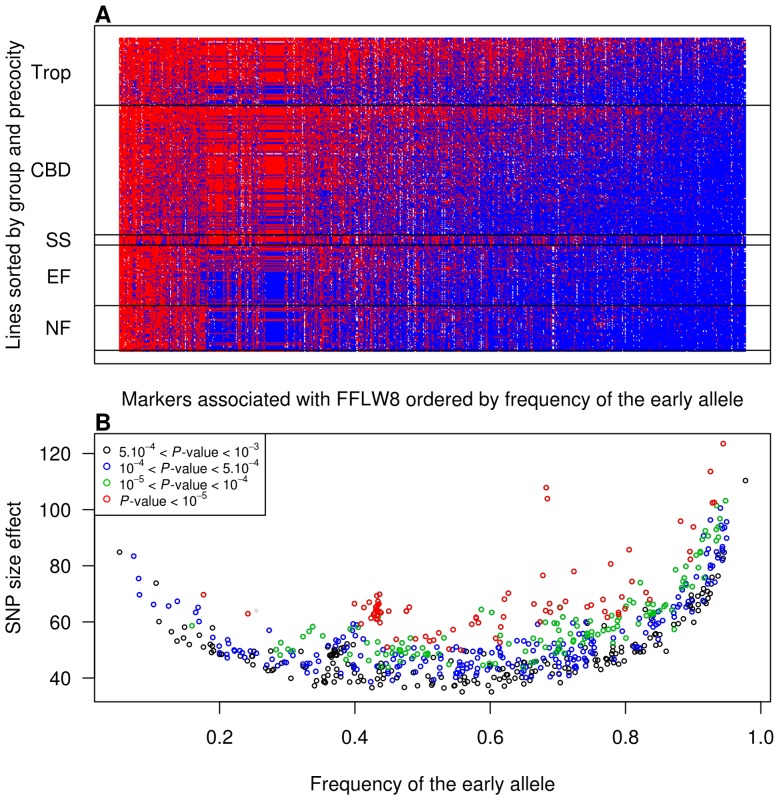
The migration of maize from tropical to temperate climates was accompanied by a dramatic evolution in flowering time. To gain insight into the genetic architecture of this adaptive trait, we conducted a 50K SNP-based genome-wide association and diversity investigation on a panel of tropical and temperate American and European representatives. Eighteen genomic regions were associated with flowering time. The number of early alleles cumulated along these regions was highly correlated with flowering time. Polymorphism in the vicinity of the ZCN8 gene, which is the closest maize homologue to Arabidopsis major flowering time (FT) gene, had the strongest effect. This polymorphism is in the vicinity of the causal factor of Vgt2 QTL. Diversity was lower, whereas differentiation and LD were higher for associated loci compared to the rest of the genome, which is consistent with selection acting on flowering time during maize migration. Selection tests also revealed supplementary loci that were highly differentiated among groups and not associated with flowering time in our panel, whereas they were in other linkage-based studies. This suggests that allele fixation led to a lack of statistical power when structure and relatedness were taken into account in a linear mixed model. Complementary designs and analysis methods are necessary to unravel the architecture of complex traits. Based on linkage disequilibrium (LD) estimates corrected for population structure, we concluded that the number of SNPs genotyped should be at least doubled to capture all QTLs contributing to the genetic architecture of polygenic traits in this panel. These results show that maize flowering time is controlled by numerous QTLs of small additive effect and that strong polygenic selection occurred under cool climatic conditions. They should contribute to more efficient genomic predictions of flowering time and facilitate the dissemination of diverse maize genetic resources under a wide range of environments.
Conflict of interest statement
Figures
Similar articles
-
Disentangling group specific QTL allele effects from genetic background epistasis using admixed individuals in GWAS: An application to maize flowering.PLoS Genet. 2020 Mar 4;16(3):e1008241. doi: 10.1371/journal.pgen.1008241. eCollection 2020 Mar. PLoS Genet. 2020. PMID: 32130208 Free PMC article.
-
Analysis of genetic differentiation and genomic variation to reveal potential regions of importance during maize improvement.BMC Plant Biol. 2015 Oct 24;15:256. doi: 10.1186/s12870-015-0646-7. BMC Plant Biol. 2015. PMID: 26496865 Free PMC article.
-
A comprehensive study of the genomic differentiation between temperate Dent and Flint maize.Genome Biol. 2016 Jul 8;17(1):137. doi: 10.1186/s13059-016-1009-x. Genome Biol. 2016. PMID: 27387028 Free PMC article.
-
Entering the second century of maize quantitative genetics.Heredity (Edinb). 2014 Jan;112(1):30-8. doi: 10.1038/hdy.2013.6. Epub 2013 Mar 6. Heredity (Edinb). 2014. PMID: 23462502 Free PMC article. Review.
-
Understanding Past, and Predicting Future, Niche Transitions based on Grass Flowering Time Variation.Plant Physiol. 2020 Jul;183(3):822-839. doi: 10.1104/pp.20.00100. Epub 2020 May 13. Plant Physiol. 2020. PMID: 32404414 Free PMC article. Review.
Cited by
-
Mapping of resistance to corn borers in a MAGIC population of maize.BMC Plant Biol. 2019 Oct 17;19(1):431. doi: 10.1186/s12870-019-2052-z. BMC Plant Biol. 2019. PMID: 31623579 Free PMC article.
-
Common gardens in teosintes reveal the establishment of a syndrome of adaptation to altitude.PLoS Genet. 2019 Dec 20;15(12):e1008512. doi: 10.1371/journal.pgen.1008512. eCollection 2019 Dec. PLoS Genet. 2019. PMID: 31860672 Free PMC article.
-
Genome-Wide Association Study of Root System Architecture in Maize.Genes (Basel). 2022 Jan 28;13(2):181. doi: 10.3390/genes13020181. Genes (Basel). 2022. PMID: 35205226 Free PMC article.
-
The genetic architecture of maize height.Genetics. 2014 Apr;196(4):1337-56. doi: 10.1534/genetics.113.159152. Epub 2014 Feb 10. Genetics. 2014. PMID: 24514905 Free PMC article.
-
Genetic and gene expression analysis of flowering time regulation by light quality in lentil.Ann Bot. 2021 Sep 3;128(4):481-496. doi: 10.1093/aob/mcab083. Ann Bot. 2021. PMID: 34185828 Free PMC article.
References
-
- Kuleshov N (1933) World's diversity of phenotypes of maize. J Am Soc Agron 25: 688–700.
-
- Buckler ES, Holland JB, Bradbury PJ, Acharya CB, Brown PJ, et al. (2009) The genetic architecture of maize flowering time. Science 325: 714–718. - PubMed
-
- Bolanos J, Edmeades GO (1996) The importance of the anthesis-silking interval in breeding for drought tolerance in tropical maize. Field Crops Research 48: 65–80.
Publication types
MeSH terms
Substances
LinkOut - more resources
Full Text Sources
Other Literature Sources
Research Materials
