. 2013 Aug 30;8(8):e72457.
doi: 10.1371/journal.pone.0072457. eCollection 2013.

Total protein analysis as a reliable loading control for quantitative fluorescent Western blotting

Affiliations

Total protein analysis as a reliable loading control for quantitative fluorescent Western blotting

Samantha L Eaton et al. PLoS One. .

Abstract

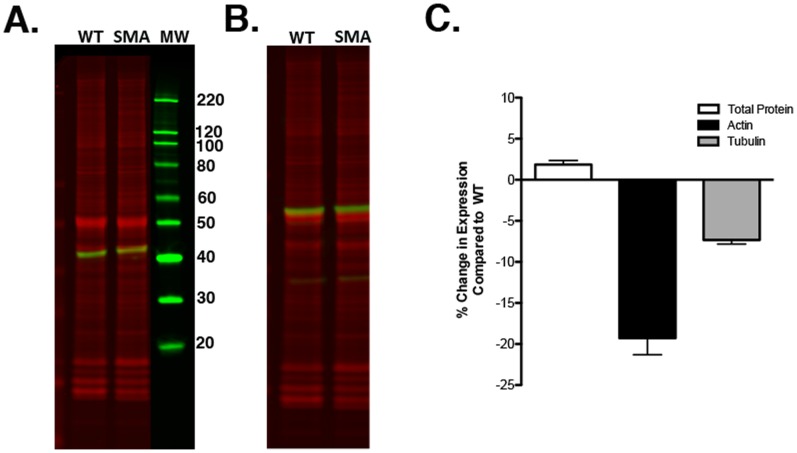
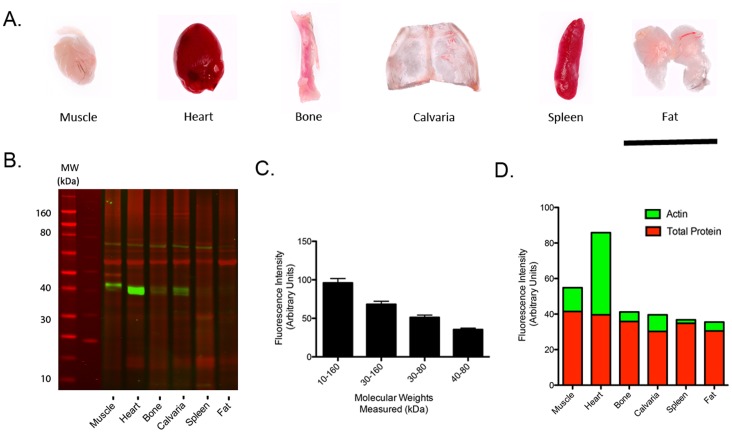
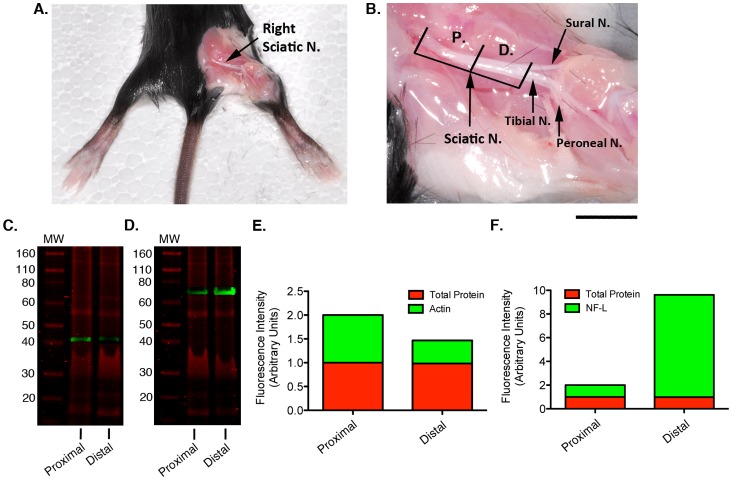
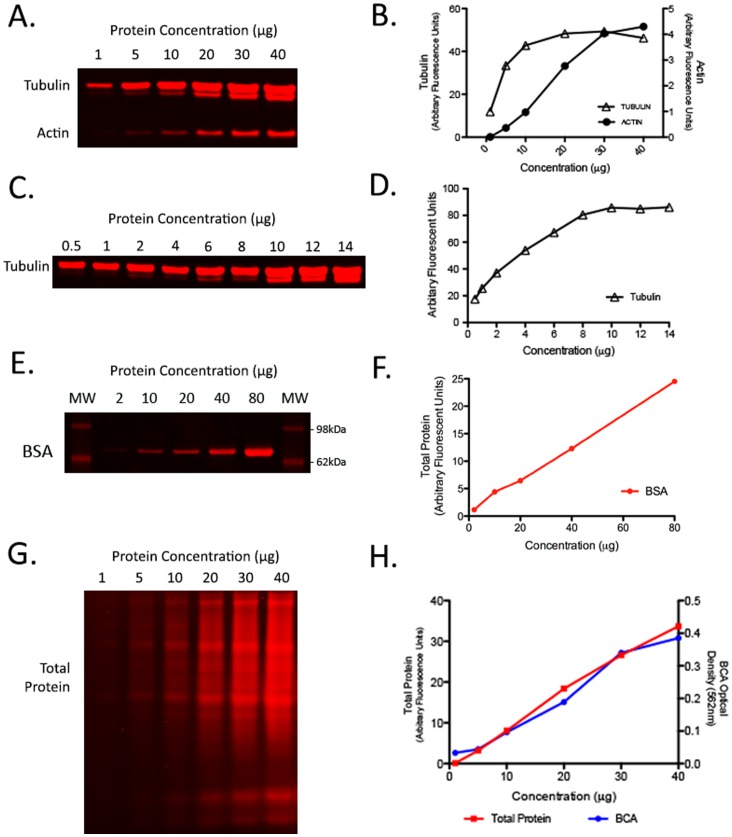
Western blotting has been a key technique for determining the relative expression of proteins within complex biological samples since the first publications in 1979. Recent developments in sensitive fluorescent labels, with truly quantifiable linear ranges and greater limits of detection, have allowed biologists to probe tissue specific pathways and processes with higher resolution than ever before. However, the application of quantitative Western blotting (QWB) to a range of healthy tissues and those from degenerative models has highlighted a problem with significant consequences for quantitative protein analysis: how can researchers conduct comparative expression analyses when many of the commonly used reference proteins (e.g. loading controls) are differentially expressed? Here we demonstrate that common controls, including actin and tubulin, are differentially expressed in tissues from a wide range of animal models of neurodegeneration. We highlight the prevalence of such alterations through examination of published "-omics" data, and demonstrate similar responses in sensitive QWB experiments. For example, QWB analysis of spinal cord from a murine model of Spinal Muscular Atrophy using an Odyssey scanner revealed that beta-actin expression was decreased by 19.3±2% compared to healthy littermate controls. Thus, normalising QWB data to β-actin in these circumstances could result in 'skewing' of all data by ∼20%. We further demonstrate that differential expression of commonly used loading controls was not restricted to the nervous system, but was also detectable across multiple tissues, including bone, fat and internal organs. Moreover, expression of these "control" proteins was not consistent between different portions of the same tissue, highlighting the importance of careful and consistent tissue sampling for QWB experiments. Finally, having illustrated the problem of selecting appropriate single protein loading controls, we demonstrate that normalisation using total protein analysis on samples run in parallel with stains such as Coomassie blue provides a more robust approach.


Conflict of interest statement

Competing Interests: The authors can confirm that author THG is currently an academic editor at PLOS ONE. This does not alter the authors’ adherence to all of the PLOS ONE

Figures

Figure 1
Figure 1. QWB for β-actin and β-tubulin demonstrates altered expression in pathological tissue.
QWB for the commonly used loading controls actin and tubulin in SMA spinal cord extracts. A. Overlay of β-Actin QWB in green (42 kDa) with total protein stained gel (red). B. Overlay of β-tubulin QWB in green (60 kDa) with total protein stained gel (red). C. Quantification of percentage change in the expression levels of β-actin (black bar) and β-tubulin (grey bar) when comparing SMA mice (SMA) to wild-type controls (WT). Total protein stain (white bar) is used as a control.
Figure 2
Figure 2. Comparative analysis of β-actin expression is highly variable across a broad range of tissues.
A. Representative images of the tissue samples in which actin expression was assessed. From left to right: Muscle (Gastrocnemius), heart, bone (femur), calvaria, spleen and fat (gonadal). Scale bar = 1 cm. B. LICOR image of QWB demonstrating considerable variability of β-actin expression (green) in muscle, heart, bone, calvaria, spleen and fat extracts. Total protein stain gel image (red) is overlaid on QWB as a control. C. Total protein measurements for different molecular weight ranges demonstrates the accuracy of protein loading across the different tissue samples. D. Stacked bar graph demonstrating the comparative variability of β-actin (green bars) and total protein measurements (red bars) for each tissue examined.
Figure 3
Figure 3. Actin & NF-L levels are not stable throughout different regions of the mouse sciatic nerve.
Differential expression in proximal versus distal sciatic nerve preparations. A. Photograph depicting the lower half of a Bl6 mouse with sciatic nerve exposed on the right leg. B. Higher magnification photograph shows sciatic nerve and subsequent branches (anatomical nomenclature taken from [26]). Scale bar: A = 1 cm, B = 0.5 cm. C. Representative LICOR overlay image of β-actin QWB (green) and total protein stained gel (red) in proximal and distal portions of sciatic nerve from the same mouse. D. Representative LICOR overlay image of NF-L QWB (green) and total protein stained gel (red) in proximal and distal portions of sciatic nerve from the same mouse. E. Stacked bar graph demonstrating the comparative expression of β-actin (green bars) and total protein stain (red bars) expression in proximal and distal sections of sciatic nerve. F. Comparative expression of NF-L (green bars) and total protein stain (red bars) expression in proximal and distal sections of sciatic nerve.
Figure 4
Figure 4. Linear range and sensitivity of total protein stain is greater than the conventional loading controls β-actin or β-tubulin.
(A) Representative LICOR image for a protein dilution series of whole brain homogenate 1, 5, 10, 20, 30, 40 µg demonstrating the working range of β-actin and β-tubulin when using QWB. (B) Quantification of protein dilution series showing the linear ranges of β-actin (black circle) and β-tubulin (open triangle). Note that tubulin expression appears to saturate at less than 10 ug of brain homogenate. (C) In order to pinpoint the saturation level a tubulin specific protein dilution series over a smaller range (0.5, 1, 2, 4, 6, 8, 10,12 and 14 µg) establishing the saturation point of β-tubulin when using QWB. (D) Quantification of β-tubulin linear range. (E) Total protein stain of dilution series 2, 10, 20, 40, 80 µg made using the bovine serum albumin standard (2 µg/µl) from the Pierce BCA kit (see methods). BSA molecular weight is 66.5 kDa. Imaging of this dilution series demonstrates imaging of a broad concentration range without saturation at a single protein mass. (F) Graphical representation of quantification from BSA dilution series in panel E. This demonstrates wide linear detection and high correlation (0.998) validating the use of total protein measurements as a viable method for detecting protein load using the LICOR system. (G) Total protein stain of whole brain homogenate dilution series 1, 5, 10, 20, 30, 40 µg demonstrates the broad concentration range detectable without saturation. (H) Correlation between the total protein stain quantification (red line) and the BCA OD (blue line) for the protein dilution series demonstrates wide linear detection and high correlation (0.996 & 0.979 respectively) validating the use of total protein measurements as a viable “loading control” for QWB using the LICOR system.

References

    1. Zellner M, Babeluk R, Diestinger M, Pirchegger P, Skeledzic S, et al. (2008) Fluorescence-based Western blotting for quantitation of protein biomarkers in clinical samples. Electrophoresis 29: 3621–3627. - PubMed
    1. Gingrich JC, Davis DR, Nguyen Q (2000) Multiplex detection and quantitation of proteins on western blots using fluorescent probes. Biotechniques 29: 636–42. - PubMed
    1. Aoki K, Yamada M, Kunida K, Yasuda S, Matsuda M (2011) Processive phosphorylation of ERK MAP kinase in mammalian cells. Proc Natl Acad Sci USA 108: 12675–12680. - PMC - PubMed
    1. Suzuki O, Koura M, Noguchi Y, Uchio-Yamada K, Matsuda J (2011) Use of sample mixtures for standard curve creation in quantitative Western blots. Exp Anim 60: 193–196. - PubMed
    1. Wishart TM, Pemberton HN, James SR, McCabe CJ, Gillingwater TH (2008) Modified cell cycle status in a mouse model of altered neuronal vulnerability (slow Wallerian degeneration (Wlds). Genome Biol 9: R101 doi:10.1186/gb-2008-9-6-r101 - DOI - PMC - PubMed

Publication types