Line orientation adaptation: local or global?
- PMID: 24023677
- PMCID: PMC3758281
- DOI: 10.1371/journal.pone.0073307
Line orientation adaptation: local or global?
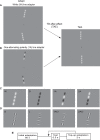
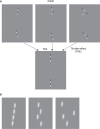
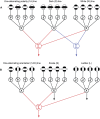
Abstract
Prolonged exposure to an oriented line shifts the perceived orientation of a subsequently observed line in the opposite direction, a phenomenon known as the tilt aftereffect (TAE). Here we consider whether the TAE for line stimuli is mediated by a mechanism that integrates the local parts of the line into a single global entity prior to the site of adaptation, or the result of the sum of local TAEs acting separately on the parts of the line. To test between these two alternatives we used the fact the TAE transfers almost completely across luminance contrast polarity [1]. We measured the TAE using adaptor and test lines that (1) either alternated in luminance polarity or were of a single polarity, and (2) either alternated in local orientation or were of a single orientation. We reasoned that if the TAE was agnostic to luminance polarity and was parts-based, we should obtain large TAEs using alternating-polarity adaptors with single-polarity tests. However we found that (i) TAEs using one-alternating-polarity adaptors with all-white tests were relatively small, increased slightly for two-alternating-polarity adaptors, and were largest with all-white or all-black adaptors. (ii) however TAEs were relatively large when the test was one-alternating polarity, irrespective of the adaptor type. (iii) The results with orientation closely mirrored those obtained with polarity with the difference that the TAE transfer across orthogonal orientations was weak. Taken together, our results demonstrate that the TAE for lines is mediated by a global shape mechanism that integrates the parts of lines into whole prior to the site of orientation adaptation. The asymmetry in the magnitude of TAE depending on whether the alternating-polarity lines was the adaptor or test can be explained by an imbalance in the population of neurons sensitive to 1(st)-and 2(nd)-order lines, with the 2(nd)-order lines being encoded by a subset of the mechanisms sensitive to 1(st)-order lines.
Conflict of interest statement
Figures


Similar articles
-
Tilt aftereffect and adaptation-induced changes in orientation tuning in visual cortex.J Neurophysiol. 2005 Dec;94(6):4038-50. doi: 10.1152/jn.00571.2004. Epub 2005 Aug 31. J Neurophysiol. 2005. PMID: 16135549
-
Global shape processing involves feature-selective and feature-agnostic coding mechanisms.J Vis. 2014 Sep 19;14(11):12. doi: 10.1167/14.11.12. J Vis. 2014. PMID: 25240064
-
The effect of perceptual contour orientation uncertainty on the tilt aftereffect.Vision Res. 2019 May;158:126-134. doi: 10.1016/j.visres.2019.02.001. Epub 2019 Mar 7. Vision Res. 2019. PMID: 30797766
-
Local contextual interactions can result in global shape misperception.J Vis. 2012 Oct 3;12(11):3. doi: 10.1167/12.11.3. Print 2012. J Vis. 2012. PMID: 23035131
-
Short test flashes produce large tilt aftereffects.Vision Res. 1984;24(12):1959-64. doi: 10.1016/0042-6989(84)90030-0. Vision Res. 1984. PMID: 6534020
Cited by
-
Spatial and chromatic properties of numerosity estimation in isolation and context.PLoS One. 2022 Sep 15;17(9):e0274564. doi: 10.1371/journal.pone.0274564. eCollection 2022. PLoS One. 2022. PMID: 36107920 Free PMC article.
-
Interaction of surface pattern and contour shape in the tilt after effects evoked by symmetry.Sci Rep. 2021 Apr 13;11(1):8024. doi: 10.1038/s41598-021-87429-y. Sci Rep. 2021. PMID: 33850220 Free PMC article.
-
Visual adaptation stronger at the horizontal than the vertical meridian: Linking performance with V1 cortical surface area.Proc Natl Acad Sci U S A. 2025 Jul 22;122(29):e2507810122. doi: 10.1073/pnas.2507810122. Epub 2025 Jul 14. Proc Natl Acad Sci U S A. 2025. PMID: 40658843
-
Shape facilitates number: brain potentials and microstates reveal the interplay between shape and numerosity in human vision.Sci Rep. 2020 Jul 24;10(1):12413. doi: 10.1038/s41598-020-68788-4. Sci Rep. 2020. PMID: 32709892 Free PMC article.
References
-
- Magnussen S, Kurtenbach W (1979) A test for contrast-polarity selectivity in the tilt aftereffect. Perception 8: 523–528. - PubMed
-
- Gibson JJ (1933) Adaptation, aftereffect and contrast in the perception of curved lines. Journal of Experimental Psychology 20: 453–467.
-
- Mitchell DE, Muir DW (1976) Does the tilt after-effect occur in the oblique meridian? Vision Res 16: 609–613. - PubMed
-
- Wenderoth P, Johnstone S (1988) The different mechanisms of the direct and indirect tilt illusions. Vision Res 28: 301–312. - PubMed
-
- Paradiso MA, Shimojo S, Nakayama K (1989) Subjective contours, tilt aftereffects, and visual cortical organization. Vision Res 29: 1205–1213. - PubMed
Publication types
MeSH terms
LinkOut - more resources
Full Text Sources
Other Literature Sources

