

Model free approach to kinetic analysis of real-time hyperpolarized 13C magnetic resonance spectroscopy data
- PMID: 24023724
- PMCID: PMC3762840
- DOI: 10.1371/journal.pone.0071996
Model free approach to kinetic analysis of real-time hyperpolarized 13C magnetic resonance spectroscopy data
Abstract
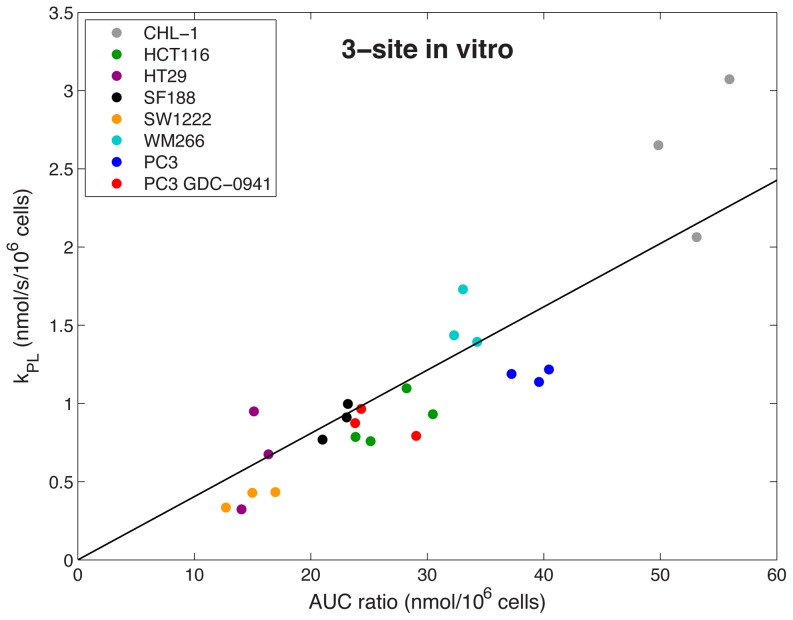
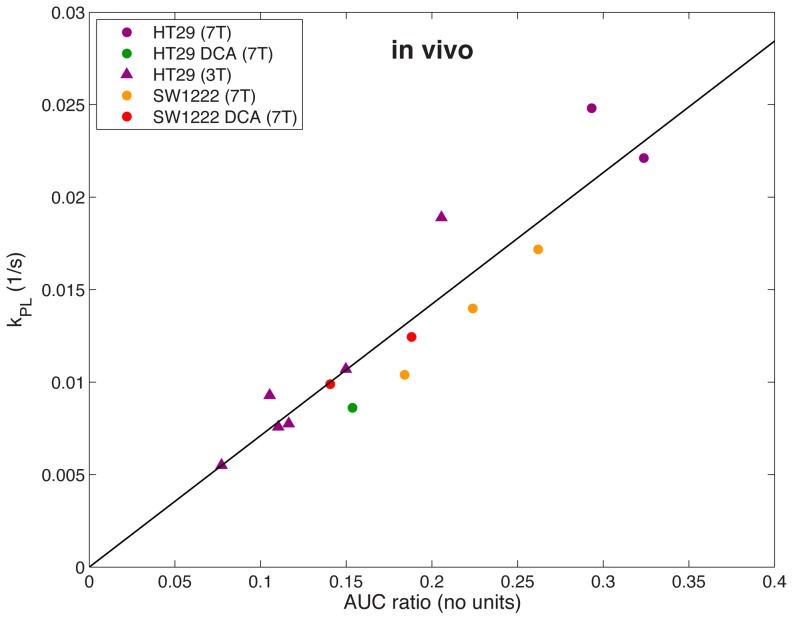
Real-time detection of the rates of metabolic flux, or exchange rates of endogenous enzymatic reactions, is now feasible in biological systems using Dynamic Nuclear Polarization Magnetic Resonance. Derivation of reaction rate kinetics from this technique typically requires multi-compartmental modeling of dynamic data, and results are therefore model-dependent and prone to misinterpretation. We present a model-free formulism based on the ratio of total areas under the curve (AUC) of the injected and product metabolite, for example pyruvate and lactate. A theoretical framework to support this novel analysis approach is described, and demonstrates that the AUC ratio is proportional to the forward rate constant k. We show that the model-free approach strongly correlates with k for whole cell in vitro experiments across a range of cancer cell lines, and detects response in cells treated with the pan-class I PI3K inhibitor GDC-0941 with comparable or greater sensitivity. The same result is seen in vivo with tumor xenograft-bearing mice, in control tumors and following drug treatment with dichloroacetate. An important finding is that the area under the curve is independent of both the input function and of any other metabolic pathways arising from the injected metabolite. This model-free approach provides a robust and clinically relevant alternative to kinetic model-based rate measurements in the clinical translation of hyperpolarized (13)C metabolic imaging in humans, where measurement of the input function can be problematic.
Conflict of interest statement
Figures
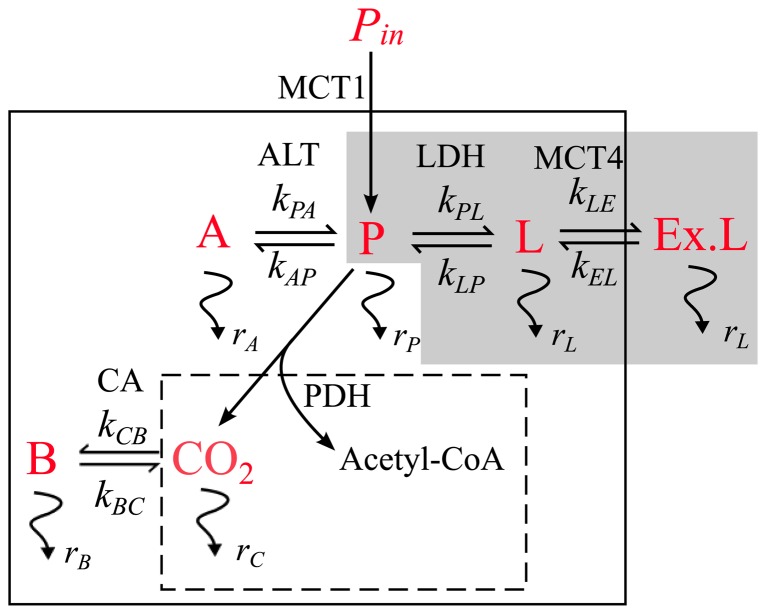
 is the effective relaxation rate of the hyperpolarized signal for metabolite i. Conversion to metabolites [1-13C]lactate (L), [1-13C]alanine (A), and [1-13C]bicarbonate (B) occur with reaction rates (k), and enzymes that catalyze reactions are shown. kEL and kLE are the rates of lactate transport into and out of the cell, governed by the MCT4 transporters. Entry of pyruvate into the TCA cycle results in conversion of the 1-13C label to CO2 and then to bicarbonate. Acetyl-CoA is not seen owing to the [1-13C] label of pyruvate being utilized in the formation of CO2. The grey box indicates the terms that need to be considered for the AUC ratio analysis method when the reaction of interest is pyruvate-lactate conversion, whereas kinetic modeling requires fitting of all terms depicted here, except for acetyl-CoA.

References
-
- Howe FA, Barton SJ, Cudlip SA, Stubbs M, Saunders DE, et al. (2003) Metabolic profiles of human brain tumors using quantitative in vivo 1H magnetic resonance spectroscopy. Magn Reson Med 49: 223–232. - PubMed
-
- Lindon JC, Holmes E, Nicholson JK (2001) Pattern recognition methods and applications in biomedical magnetic resonance. Prog Nucl Magn Reson Spectrosc 39: 1–40.
-
- Coen M, Holmes E, Lindon JC, Nicholson JK (2008) NMR-based metabolic profiling and metabonomic approaches to problems in molecular toxicology. Chem Res Toxicol 21: 9–27. - PubMed
-
- Beloueche-Babari M, Workman P, Leach MO (2011) Exploiting tumor metabolism for non-invasive imaging of the therapeutic activity of molecularly targeted anticancer agents. Cell Cycle 10: 2883–2893. - PubMed
-
- Peet AC, Arvanitis TN, Leach MO, Waldman AD (2012) Functional imaging in adult and paediatric brain tumours. Nat Rev Clin Oncol 9: 700–711. - PubMed
Publication types
MeSH terms
Substances
Grants and funding
LinkOut - more resources
Full Text Sources
Other Literature Sources
