. 2013 Sep 4;8(9):e73535.
doi: 10.1371/journal.pone.0073535. eCollection 2013.

Evolutionary origin of the Scombridae (tunas and mackerels): members of a paleogene adaptive radiation with 14 other pelagic fish families

Affiliations

Evolutionary origin of the Scombridae (tunas and mackerels): members of a paleogene adaptive radiation with 14 other pelagic fish families

Masaki Miya et al. PLoS One. .

Abstract

Uncertainties surrounding the evolutionary origin of the epipelagic fish family Scombridae (tunas and mackerels) are symptomatic of the difficulties in resolving suprafamilial relationships within Percomorpha, a hyperdiverse teleost radiation that contains approximately 17,000 species placed in 13 ill-defined orders and 269 families. Here we find that scombrids share a common ancestry with 14 families based on (i) bioinformatic analyses using partial mitochondrial and nuclear gene sequences from all percomorphs deposited in GenBank (10,733 sequences) and (ii) subsequent mitogenomic analysis based on 57 species from those targeted 15 families and 67 outgroup taxa. Morphological heterogeneity among these 15 families is so extraordinary that they have been placed in six different perciform suborders. However, members of the 15 families are either coastal or oceanic pelagic in their ecology with diverse modes of life, suggesting that they represent a previously undetected adaptive radiation in the pelagic realm. Time-calibrated phylogenies imply that scombrids originated from a deep-ocean ancestor and began to radiate after the end-Cretaceous when large predatory epipelagic fishes were selective victims of the Cretaceous-Paleogene mass extinction. We name this clade of open-ocean fishes containing Scombridae "Pelagia" in reference to the common habitat preference that links the 15 families.


Conflict of interest statement

Competing Interests: The authors have declared that no competing interests exist.

Figures

Figure 1
Figure 1. The 15 perciform families comprising the novel clade found in this study.
Numerals in parentheses beside family names denote numbers of genera and species recognized in a current classification . The 15 families are distributed across 6 suborders in the order Perciformes, which includes 20 suborders, 160 families, 1,539 genera, and 10,033 species . (a) Pomatomidae (Pomatomus saltarix; ©State of Queensland, Department of Agriculture, Fisheries and Forestry, Australia); (b) Bramidae (Brama japonica); (c) Caristiidae (Platyberyx macropus); (d) Arripidae (Arripis trutta; photo courtesy of Pat Tully, © NSW Trade & Investment Primary Industries, New Zealand); (e) Chiasmodontidae (Chiasmodon niger); (f) Icosteidae (Icosteus aenigmaticus); (g) Scombrolabracidae ( Scombrolabrax heterolepis; ©Marine Fisheries Research and Development Center, Fisheries Research Agency, Japan); (h) Gempylidae (Promethichthys prometheus and Ruvettus pretiosus); (i) Trichiuridae (Trachurus japonicus and Evoxymetopon taeniatus); (j) Scombridae (Thunnus orientalis and Scomber australasicus); (k) Centrolophoridae (Psenopsis anomala); (l) Nomeidae (Cubiceps squamicepsi); (m) Ariommatidae (Ariomma indica); (n) Tetragonuridae (Tetraganurus cuvieri); and (o) Stromateidae (Pampus argenteus). Photos (b, f, h–j, m–o) and (k, l) courtesy of Hiroshi Senou and Hisayuki Suzuki, respectively (©Kanagawa Prefectural Museum of Natural History).
Figure 2
Figure 2. The best-scoring maximum likelihood trees based on 6 partial mitochondrial genes downloaded from GenBank.
Only a portion of Pelagia shown. Numerals beside internal branches indicate bootstrap proportions based on 1000 replicates. Subordinal groupings of the 15 families are colored following Fig. 1. All tree files are available in Text S2.
Figure 3
Figure 3. The best-scoring maximum likelihood trees based on 2 partial nuclear genes downloaded from GenBank.
Only a portion of Pelagia shown. Numerals beside internal branches indicate bootstrap proportions based on 1000 replicates. Subordinal groupings of the 15 families are colored following Fig. 1. All tree files are available in Text S2.
Figure 4
Figure 4. The best-scoring maximum-likelihood (ML) tree of the 124 species based on unambiguously aligned whole mitogenome sequences (12n3rRTn dataset; 13,506 positions; ln L = –365160.5637).
Numerals beside internal branches indicate bootstrap proportions (BPs) of ≥50% based on 1000 replicates. Arrowheads indicate those internal branches that are collapsed when a strict consensus tree is constructed from the best-scoring ML trees derived from 2 different data sets that include 3rd codon positions (12n3rRTn and 123nRTn datasets). Terminal and internal branches with asterisks indicate those shortened to a half of the original ones for a practical purpose. Subordinal grouping of the 15 families are colored following Fig. 1 and black bars denote 5 trans-familial clades supported by BPs of ≥87%. A tree file is available in Text S2.
Figure 5
Figure 5. The best-scoring maximum likelihood trees based on whole mitogenome sequences from the 12n3rRTn data set with bootstrap proportions (BPs) from the 4 data sets.
BPs are based on 1000 replicates and those of ≥50% only indicated with the following sequences (12n3rRTn,123nRTn, 12nRTn, 123aRTn).
Figure 6
Figure 6. Timetree of Pelagia and outgroups derived from the Bayesian relaxed-molecular clock method using MCMCTREE implemented in PAML v. 4.5 .
Five nodes were used for time constraints based on fossil record (arrowheads; for details, see Table 2). Horizontal bars indicate 95% credible intervals of the divergence time estimates.
Figure 7
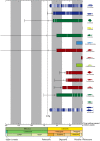
Figure 7. Summary of the fossil record of Pelagia, indicating rapid appearance of constituent lineages in the Paleogene.
Solid bars represent known stratigraphic range, with white lines showing approximate distribution of horizons yielding body-fossil remains of groups (horizons within individual stratigraphic intervals are randomly distributed for clarity). One-tailed 95% (wide bracket) and 50% (narrow bracket) confidence intervals on the first appearance of each group assuming uniform preservation potential are indicated. Color-coding of classical taxonomic groups to which families have been assigned follows that used in Fig. 1. For fossil horizons yielding the 15 families of Pelagia, see Table S4.
Figure 8
Figure 8. Comparison of paleontological timescales for the evolution of Pelagia with molecular clock estimates using five well-constrained fossil calibrations representing taxa outside of Pelagia (left) and with those same fossil calibrations plus additional calibrations derived from a vicariance hypothesis of cichlid biogeography (right).
Points are specified by the paleontological maximum-likelihood estimate for the origin of the total-group families for which this value can be calculated and the mean molecular age estimate for that same lineage. Error bars represent 95% confidence intervals. Color-coding of classical taxonomic groups to which families have been assigned follows that used in Fig. 1. RSS = residual sum of squares measuring deviation from a hypothesized 1∶1 relationship. For paleontological timescale for the 15 families of Pelagia, see Table S5.
Figure 9
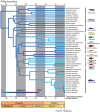
Figure 9. Mean depth ecology of Pelagia reconstructed on the timetree (Fig. 6).
Depths are the averages of minimum and maximum depths reported in FishBase. Depth ecologies for internal nodes are estimated using maximum likelihood. The last common ancestor of Pelagia is inferred to have been mesopelagic. The invasion of the epipelagic realm by scombrids and other groups of Pelagia occurred in the early Paleogene.

References

    1. Helfman GS, Collette BB, Facey DE, Bowen BW (2009) The diversity of fishes. Oxford, UK: Wiley-Blackwell. xviii +720 p.
    1. Allen LG, Cross JN (2006) Surface waters. In: Allen LG, Pondella DJ, Horn MH, editors. The ecology of marine fishes: California and adjacent waters. Berkeley: University of California Press. 320–341.
    1. Tyus HM (2012) Ecology and coservation of fishes. London: CRC Press. 529 p.
    1. Froese R, Pauly D (2000) FishBase 2000: concepts, design and data sources. Los Baños, Laguna, Phillipines: ICLARM.
    1. Magnuson JJ (1979) Locomotion by scombrid fishes: hydromechanics, morphology, and behavior. In: Hoar WS, Randall DJ, editors. Fish physiology. London: Academic Press. 239–313.

Publication types