

Lipidomic profiling of Saccharomyces cerevisiae and Zygosaccharomyces bailii reveals critical changes in lipid composition in response to acetic acid stress
- PMID: 24023914
- PMCID: PMC3762712
- DOI: 10.1371/journal.pone.0073936
Lipidomic profiling of Saccharomyces cerevisiae and Zygosaccharomyces bailii reveals critical changes in lipid composition in response to acetic acid stress
Abstract
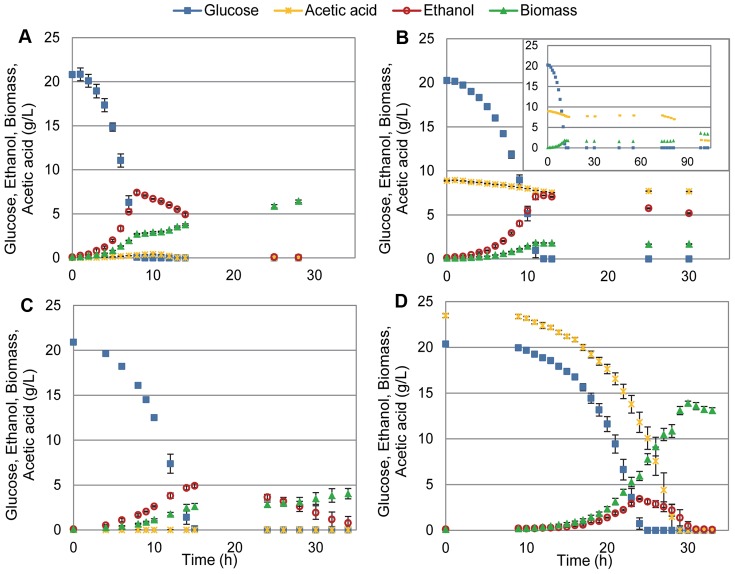
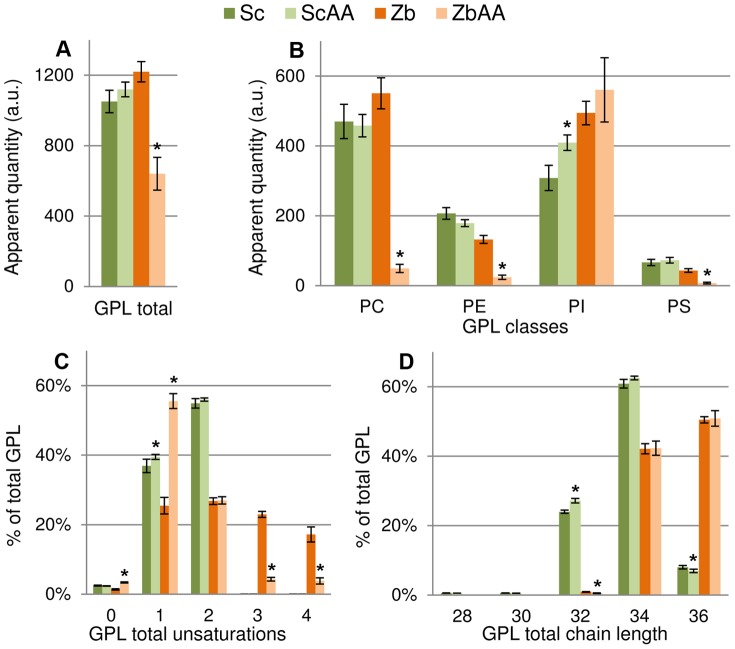
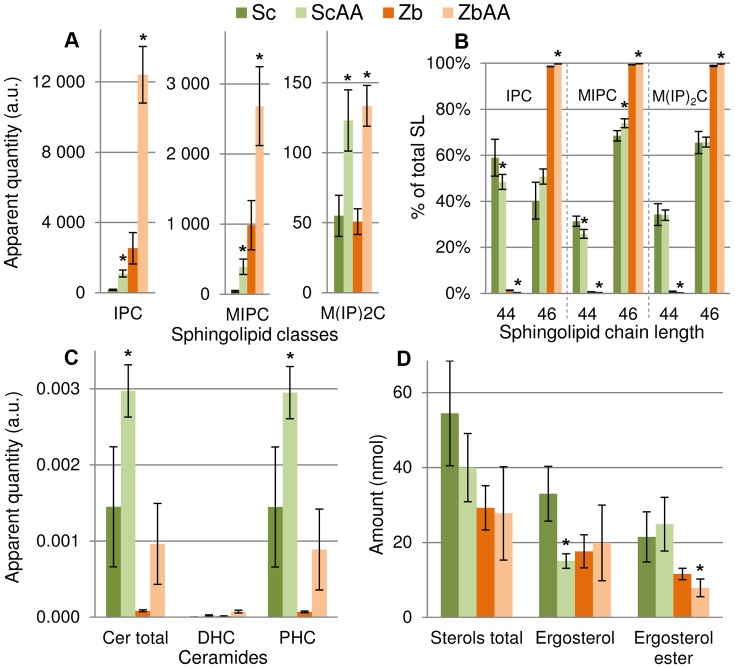
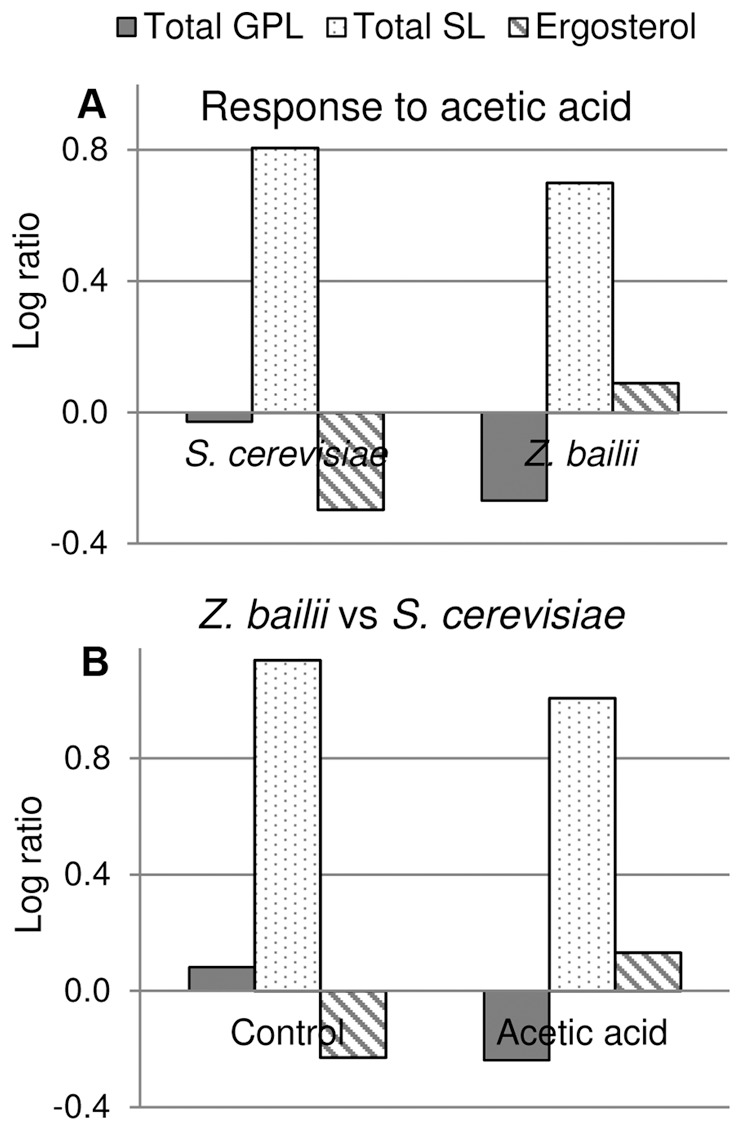
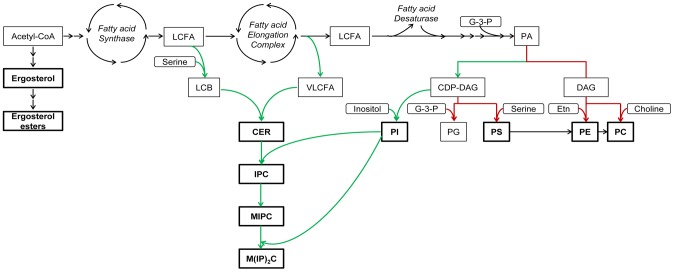
When using microorganisms as cell factories in the production of bio-based fuels or chemicals from lignocellulosic hydrolysate, inhibitory concentrations of acetic acid, released from the biomass, reduce the production rate. The undissociated form of acetic acid enters the cell by passive diffusion across the lipid bilayer, mediating toxic effects inside the cell. In order to elucidate a possible link between lipid composition and acetic acid stress, the present study presents detailed lipidomic profiling of the major lipid species found in the plasma membrane, including glycerophospholipids, sphingolipids and sterols, in Saccharomyces cerevisiae (CEN.PK 113_7D) and Zygosaccharomyces bailii (CBS7555) cultured with acetic acid. Detailed physiological characterization of the response of the two yeasts to acetic acid has also been performed in aerobic batch cultivations using bioreactors. Physiological characterization revealed, as expected, that Z. bailii is more tolerant to acetic acid than S. cerevisiae. Z. bailii grew at acetic acid concentrations above 24 g L(-1), while limited growth of S. cerevisiae was observed after 11 h when cultured with only 12 g L(-1) acetic acid. Detailed lipidomic profiling using electrospray ionization, multiple-reaction-monitoring mass spectrometry (ESI-MRM-MS) showed remarkable changes in the glycerophospholipid composition of Z. bailii, including an increase in saturated glycerophospholipids and considerable increases in complex sphingolipids in both S. cerevisiae (IPC 6.2×, MIPC 9.1×, M(IP)2C 2.2×) and Z. bailii (IPC 4.9×, MIPC 2.7×, M(IP)2C 2.7×), when cultured with acetic acid. In addition, the basal level of complex sphingolipids was significantly higher in Z. bailii than in S. cerevisiae, further emphasizing the proposed link between lipid saturation, high sphingolipid levels and acetic acid tolerance. The results also suggest that acetic acid tolerance is associated with the ability of a given strain to generate large rearrangements in its lipid profile.
Conflict of interest statement
Figures
Similar articles
-
Individual cells of Saccharomyces cerevisiae and Zygosaccharomyces bailii exhibit different short-term intracellular pH responses to acetic acid.Arch Microbiol. 2000 Jul-Aug;174(1-2):125-8. doi: 10.1007/s002030000185. Arch Microbiol. 2000. PMID: 10985752
-
Search for genes responsible for the remarkably high acetic acid tolerance of a Zygosaccharomyces bailii-derived interspecies hybrid strain.BMC Genomics. 2015 Dec 16;16:1070. doi: 10.1186/s12864-015-2278-6. BMC Genomics. 2015. PMID: 26673744 Free PMC article.
-
Transcriptional profiling of Zygosaccharomyces bailii early response to acetic acid or copper stress mediated by ZbHaa1.Sci Rep. 2018 Sep 20;8(1):14122. doi: 10.1038/s41598-018-32266-9. Sci Rep. 2018. PMID: 30237501 Free PMC article.
-
Physiological Genomics of the Highly Weak-Acid-Tolerant Food Spoilage Yeasts of Zygosaccharomyces bailii sensu lato.Prog Mol Subcell Biol. 2019;58:85-109. doi: 10.1007/978-3-030-13035-0_4. Prog Mol Subcell Biol. 2019. PMID: 30911890 Review.
-
The spoilage yeast Zygosaccharomyces bailii: Foe or friend?Yeast. 2017 Sep;34(9):359-370. doi: 10.1002/yea.3238. Epub 2017 Jun 29. Yeast. 2017. PMID: 28556381 Review.
Cited by
-
Deletion of Atg22 gene contributes to reduce programmed cell death induced by acetic acid stress in Saccharomyces cerevisiae.Biotechnol Biofuels. 2019 Dec 27;12:298. doi: 10.1186/s13068-019-1638-x. eCollection 2019. Biotechnol Biofuels. 2019. PMID: 31890026 Free PMC article.
-
The Presence of Pretreated Lignocellulosic Solids from Birch during Saccharomyces cerevisiae Fermentations Leads to Increased Tolerance to Inhibitors--A Proteomic Study of the Effects.PLoS One. 2016 Feb 5;11(2):e0148635. doi: 10.1371/journal.pone.0148635. eCollection 2016. PLoS One. 2016. PMID: 26849651 Free PMC article.
-
The Influence of Heteroresistance on Minimum Inhibitory Concentration, Investigated Using Weak-Acid Stress in Food Spoilage Yeasts.Appl Environ Microbiol. 2023 Jun 28;89(6):e0012523. doi: 10.1128/aem.00125-23. Epub 2023 May 31. Appl Environ Microbiol. 2023. PMID: 37255457 Free PMC article.
-
Adaptive laboratory evolution under acetic acid stress enhances the multistress tolerance and ethanol production efficiency of Pichia kudriavzevii from lignocellulosic biomass.Sci Rep. 2023 Nov 28;13(1):21000. doi: 10.1038/s41598-023-48408-7. Sci Rep. 2023. PMID: 38017261 Free PMC article.
-
Unveiling the binding and orientation of the antimicrobial peptide Plantaricin 149 in zwitterionic and negatively charged membranes.Eur Biophys J. 2019 Oct;48(7):621-633. doi: 10.1007/s00249-019-01387-y. Epub 2019 Jul 19. Eur Biophys J. 2019. PMID: 31324942
References
-
- Laluce C, Schenberg ACG, Gallardo JCM, Coradello LFC, Pombeiro-Sponchiado SR (2012) Advances and developments in strategies to improve strains of Saccharomyces cerevisiae and processes to obtain the lignocellulosic ethanol - A review. Applied Biochemistry and Biotechnology 166: 1908–1926. - PubMed
-
- Palmqvist E, Hahn-Hägerdal B (2000) Fermentation of lignocellulosic hydrolysates. II: Inhibitors and mechanisms of inhibition. Bioresource Technology 74: 25–33.
-
- Zhu JY, Gleisner R, Scott CT, Luo XL, Tian S (2011) High titer ethanol production from simultaneous enzymatic saccharification and fermentation of aspen at high solids: A comparison between SPORL and dilute acid pretreatments. Bioresource Technology 102: 8921–8929. - PubMed
-
- Monavari S, Galbe M, Zacchi G (2011) Influence of impregnation with lactic acid on sugar yields from steam pretreatment of sugarcane bagasse and spruce, for bioethanol production. Biomass and Bioenergy 35: 3115–3122.
Publication types
MeSH terms
Substances
LinkOut - more resources
Full Text Sources
Other Literature Sources
Molecular Biology Databases
