

Specific extracellular matrix remodeling signature of colon hepatic metastases
- PMID: 24023955
- PMCID: PMC3762755
- DOI: 10.1371/journal.pone.0074599
Specific extracellular matrix remodeling signature of colon hepatic metastases
Abstract
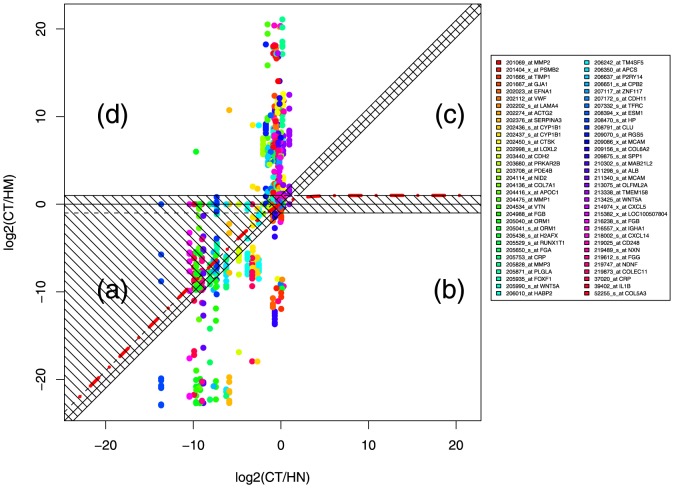
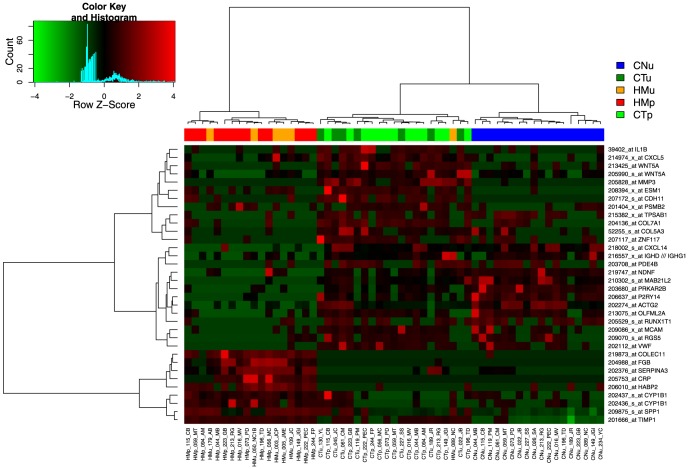
To identify genes implicated in metastatic colonization of the liver in colorectal cancer, we collected pairs of primary tumors and hepatic metastases before chemotherapy in 13 patients. We compared mRNA expression in the pairs of patients to identify genes deregulated during metastatic evolution. We then validated the identified genes using data obtained by different groups. The 33-gene signature was able to classify 87% of hepatic metastases, 98% of primary tumors, 97% of normal colon mucosa, and 95% of normal liver tissues in six datasets obtained using five different microarray platforms. The identified genes are specific to colon cancer and hepatic metastases since other metastatic locations and hepatic metastases originating from breast cancer were not classified by the signature. Gene Ontology term analysis showed that 50% of the genes are implicated in extracellular matrix remodeling, and more precisely in cell adhesion, extracellular matrix organization and angiogenesis. Because of the high efficiency of the signature to classify colon hepatic metastases, the identified genes represent promising targets to develop new therapies that will specifically affect hepatic metastasis microenvironment.
Conflict of interest statement
Figures


References
-
- Ferlay J, Shin H, Bray F, Forman D, Mathers C, et al. (n.d.) GLOBOCAN 2008 v2.0, Cancer Incidence and Mortality Worldwide: IARC CancerBase No. 10 Internet. Available: http://globocan.iarc.fr.
-
- Pawlik TM, Choti MA (2007) Surgical therapy for colorectal metastases to the liver. J Gastrointest Surg Off J Soc Surg Aliment Tract 11: 1057–1077 doi:10.1007/s11605-006-0061-3 - DOI - PubMed
-
- Fidler IJ (2003) The pathogenesis of cancer metastasis: the “seed and soil” hypothesis revisited. Nat Rev Cancer 3: 453–458 doi:10.1038/nrc1098 - DOI - PubMed
-
- André T, Boni C, Navarro M, Tabernero J, Hickish T, et al. (2009) Improved overall survival with oxaliplatin, fluorouracil, and leucovorin as adjuvant treatment in stage II or III colon cancer in the MOSAIC trial. J Clin Oncol Off J Am Soc Clin Oncol 27: 3109–3116 doi:10.1200/JCO.2008.20.6771 - DOI - PubMed
-
- Nannini M, Pantaleo MA, Maleddu A, Astolfi A, Formica S, et al. (2009) Gene expression profiling in colorectal cancer using microarray technologies: results and perspectives. Cancer Treat Rev 35: 201–209 doi:10.1016/j.ctrv.2008.10.006 - DOI - PubMed
Publication types
MeSH terms
Substances
Associated data
- Actions
- Actions
LinkOut - more resources
Full Text Sources
Other Literature Sources
Medical
Molecular Biology Databases
