

Friedreich ataxia patient tissues exhibit increased 5-hydroxymethylcytosine modification and decreased CTCF binding at the FXN locus
- PMID: 24023969
- PMCID: PMC3762780
- DOI: 10.1371/journal.pone.0074956
Friedreich ataxia patient tissues exhibit increased 5-hydroxymethylcytosine modification and decreased CTCF binding at the FXN locus
Abstract
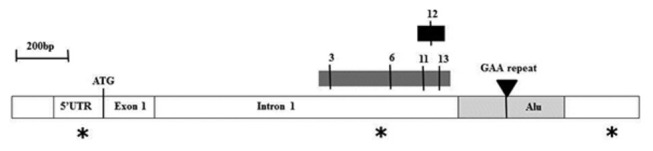
Background: Friedreich ataxia (FRDA) is caused by a homozygous GAA repeat expansion mutation within intron 1 of the FXN gene, which induces epigenetic changes and FXN gene silencing. Bisulfite sequencing studies have identified 5-methylcytosine (5 mC) DNA methylation as one of the epigenetic changes that may be involved in this process. However, analysis of samples by bisulfite sequencing is a time-consuming procedure. In addition, it has recently been shown that 5-hydroxymethylcytosine (5 hmC) is also present in mammalian DNA, and bisulfite sequencing cannot distinguish between 5 hmC and 5 mC.
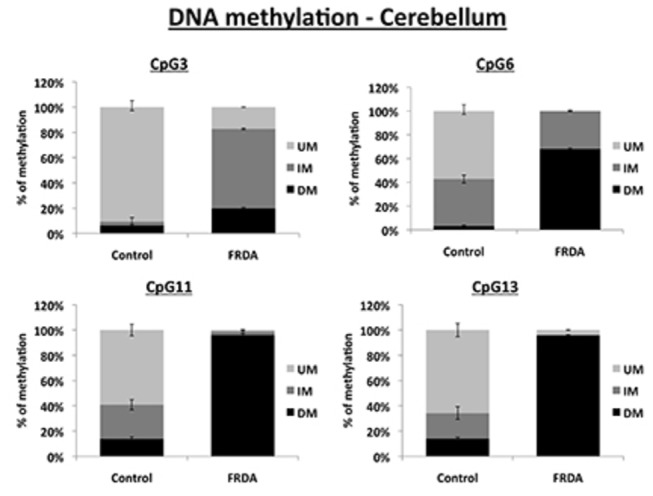
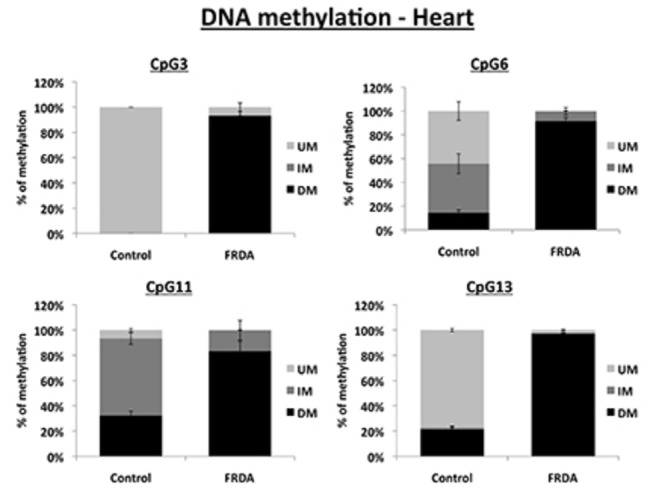
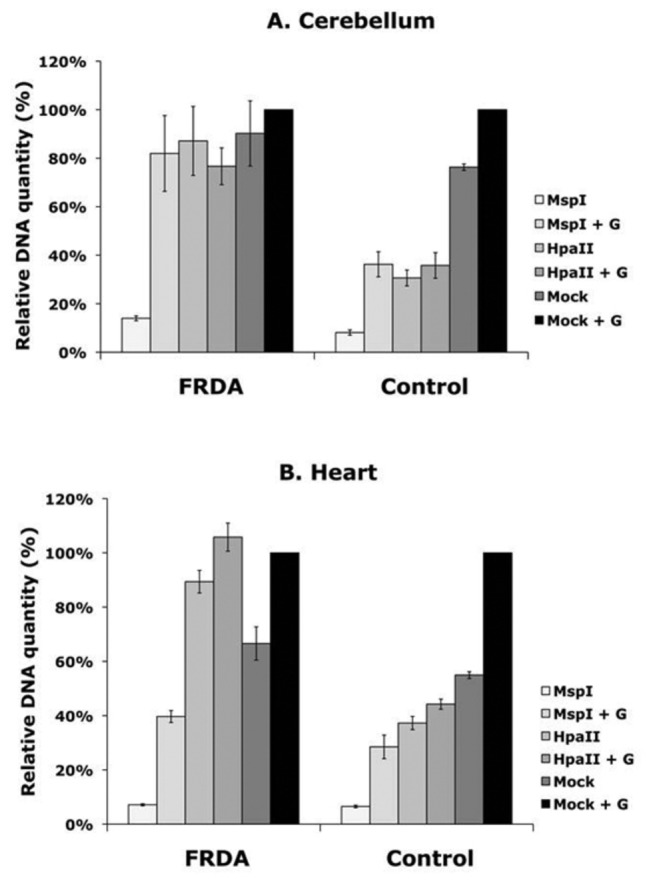
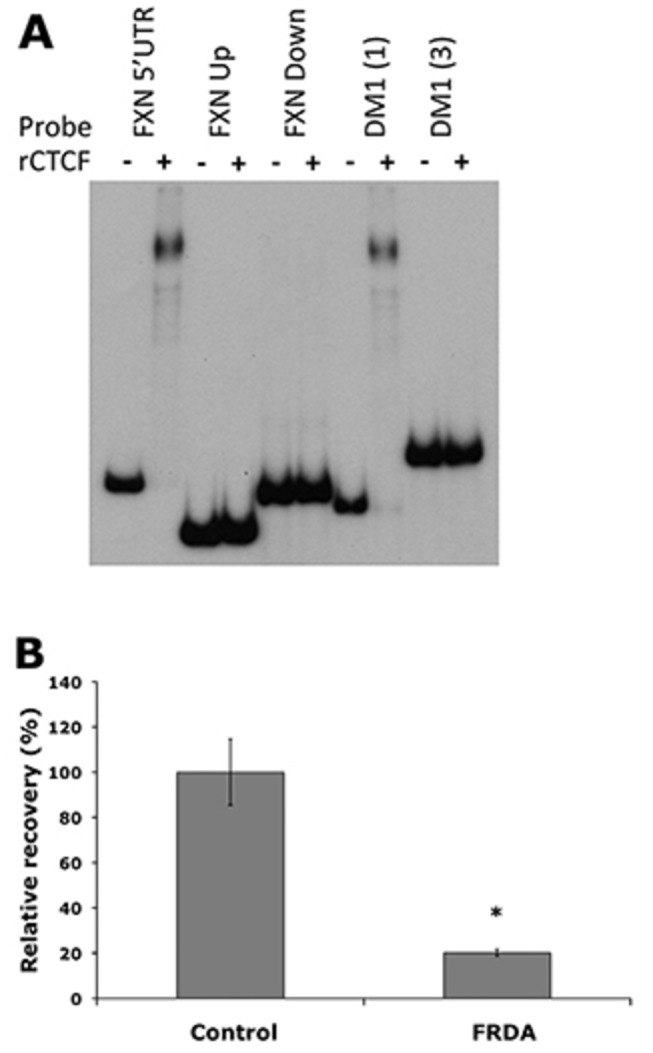
Methodology/principal findings: We have developed specific MethylScreen restriction enzyme digestion and qPCR-based protocols to more rapidly quantify DNA methylation at four CpG sites in the FXN upstream GAA region. Increased DNA methylation was confirmed at all four CpG sites in both FRDA cerebellum and heart tissues. We have also analysed the DNA methylation status in FRDA cerebellum and heart tissues using an approach that enables distinction between 5 hmC and 5 mC. Our analysis reveals that the majority of DNA methylation in both FRDA and unaffected tissues actually comprises 5 hmC rather than 5 mC. We have also identified decreased occupancy of the chromatin insulator protein CTCF (CCCTC-binding factor) at the FXN 5' UTR region in the same FRDA cerebellum tissues.
Conclusions/significance: Increased DNA methylation at the FXN upstream GAA region, primarily 5 hmC rather than 5 mC, and decreased CTCF occupancy at the FXN 5' UTR are associated with FRDA disease-relevant human tissues. The role of such molecular mechanisms in FRDA pathogenesis has now to be determined.
Conflict of interest statement
Figures
References
-
- Campuzano V, Montermini L, Moltò MD, Pianese L, Cossée M et al. (1996) Friedreich’s ataxia: autosomal recessive disease caused by an intronic GAA triplet repeat expansion. Science 271: 1423-1427. doi:10.1126/science.271.5254.1423. PubMed: 8596916. - DOI - PubMed
-
- Pandolfo M (2009) Friedreich ataxia: the clinical picture. J Neurol 256 Suppl 1: 3-8. doi:10.1007/s00415-009-0097-x. PubMed: 19283344. - DOI - PubMed
-
- Sharma R, De Biase I, Gómez M, Delatycki MB, Ashizawa T et al. (2004) Friedreich ataxia in carriers of unstable borderline GAA triplet-repeat alleles. Ann Neurol 56: 898-901. doi:10.1002/ana.20333. PubMed: 15562408. - DOI - PubMed
-
- Dürr A, Cossee M, Agid Y, Campuzano V, Mignard C et al. (1996) Clinical and genetic abnormalities in patients with Friedreich’s ataxia. N Engl J Med 335: 1169-1175. doi:10.1056/NEJM199610173351601. PubMed: 8815938. - DOI - PubMed
Publication types
MeSH terms
Substances
Grants and funding
LinkOut - more resources
Full Text Sources
Other Literature Sources
Medical
Miscellaneous
