. 2013 Aug 29;2(1):419.
doi: 10.1186/2193-1801-2-419. eCollection 2013.

Passive carriage of rabies virus by dendritic cells

Affiliations

Passive carriage of rabies virus by dendritic cells

Kazuyo Senba et al. Springerplus. .

Abstract

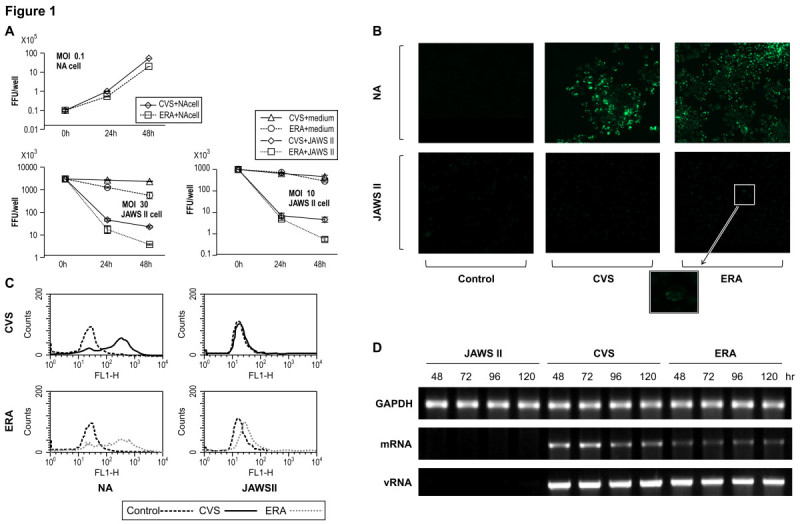
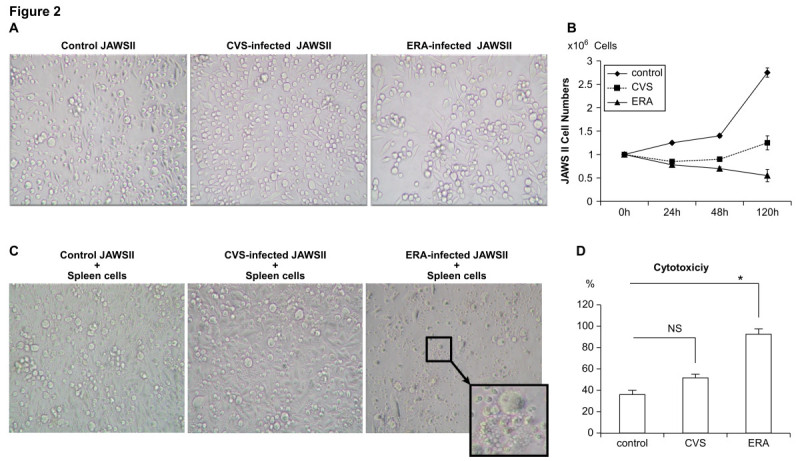
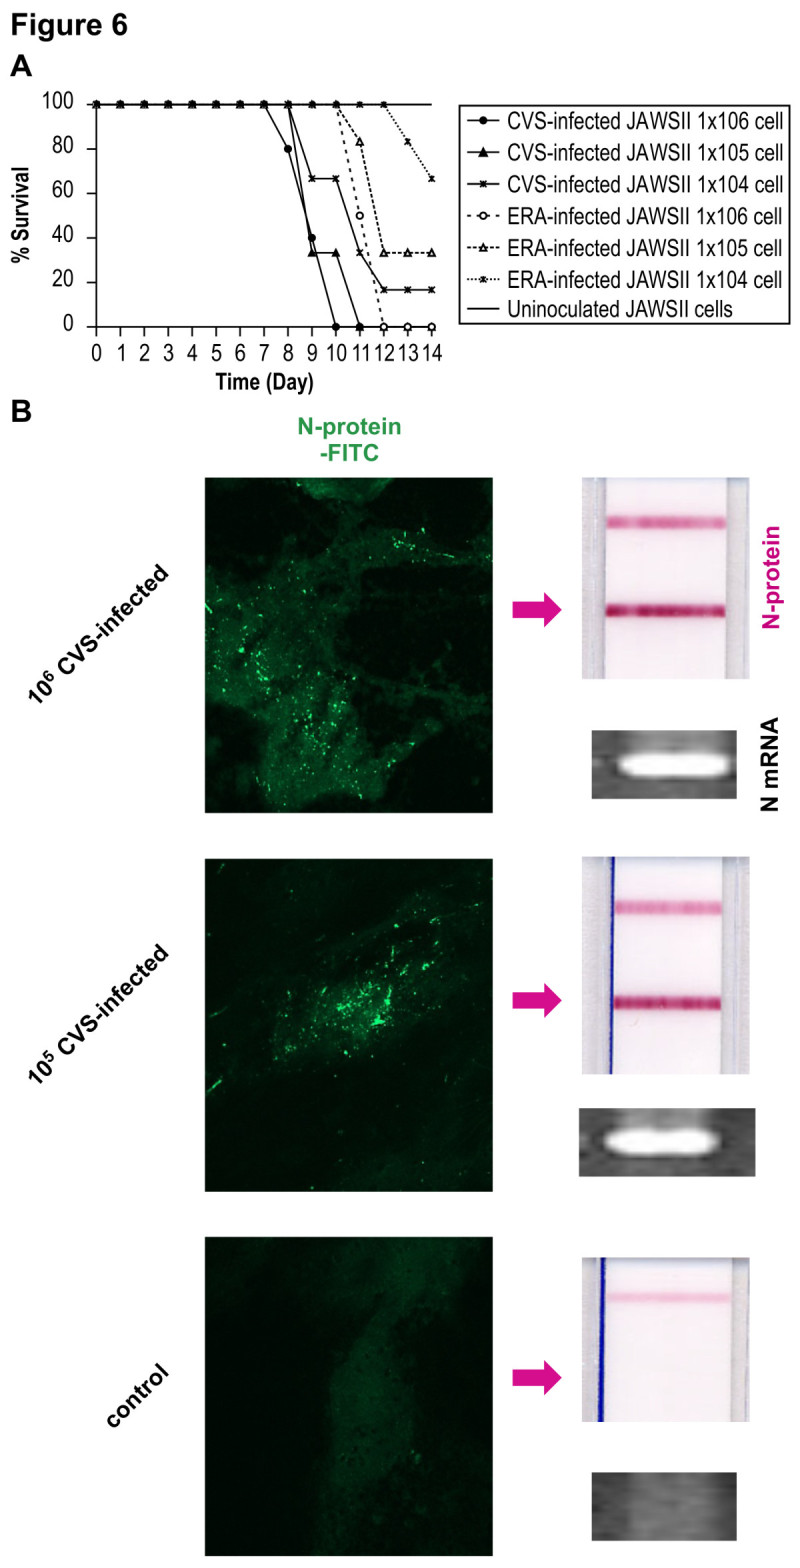
The rabies virus (RABV) is highly neurotropic and it uses evasive strategies to successfully evade the host immune system. Because rabies is often fatal, understanding the basic processes of the virus-host interactions, particularly in the initial events of infection, is critical for the design of new therapeutic approaches to target RABV. Here, we examined the possible role of dendritic cells (DCs) in the transmission of RABV to neural cells at peripheral site of exposure. Viral replication only occurred at a low level in the DC cell line, JAWS II, after its infection with either pathogenic RABV (CVS strain) or low-pathogenic RABV (ERA strain), and no progeny viruses were produced in the culture supernatants. However, both viral genomic RNAs were retained in the long term after infection and maintained their infectivity. The biggest difference between CVS and ERA was in their ability to induce type I interferons. Although the ERA-infected JAWS II cells exhibited cytopathic effect and were apparently killed by normal spleen cells in vitro, the CVS-infected JAWS II cells showed milder cytopathic effect and less lysis when cocultured with spleen cells. Strongly increased expression of major histocompatibility complex classes I, costimulatory molecules (CD80 and CD86), type I interferons and Toll- like receptor 3, and was observed only in the ERA-inoculated JAWS II cells and not in those inoculated with CVS. During the silencing of the cellular immune response in the DCs, the pathogenic CVS strain cryptically maintained an infectious viral genome and was capable of transmitting infectious RABV to permissive neural cells. These findings demonstrate that DCs may play a role in the passive carriage of RABV during natural rabies infections.

Keywords: Dendritic cells; Immune invasion; Rabies virus.


Figures

Figure 1
Figure 1
Virus growth in JAWS II and NA cells inoculated with rabies virus. (A) Virus growth curves in NA and JAWS II cells. CVS or ERA was infected at an MOI of 0.1 (NA) or 10,30 (JAWS II), and samples were collected 24 and 48 h after infection. n = 3. Error bars represent mean ± SEM. The black line and dotted line represent the viral titers of CVS and ERA, respectively. Decline in the infected viral titer was determined by using JAWS II cells (+JAWS II) and cell-free conditions (+medium). (B and C) The expression of the viral N protein was analyzed with both a laser scanning microscope and a flow cytometer. After the infection of JAWS II cells with CVS or ERA, the cells were permeabilized with IntraPrep Permeabilization Reagent, and then incubated with FITC-conjugated anti-RABV N MAb. (D) Detection of mRNA and genomic RNA in CVS- or ERA-infected JAWS II cells. The upper panel shows GAPDH, the middle panel shows the expression of mRNA from the RABV N gene detected by RT–PCR, using a poly (T)15 primer for the synthesis of the first-strand cDNA and the lower panel shows viral RNA. The experiments were performed three times and representative data are shown. CVS or ERA at an MOI of 10 was used for the experiments shown in (B to D).
Figure 2
Figure 2
Morphological changes in JAWS II cells after RABV infection and coculture with mouse spleen cells. (A) Light-microscopic images of uninfected (left), CVS-infected (middle), and ERA-infected (right) JAWS II cells; (B) the numbers of viable cells were determined by Trypan blue staining 24, 48, 120 h after re-plated. (C and D) uninfected (left), CVS-infected (middle), and ERA-infected (right) JAWS II cells were cocultured with mouse spleen cells for a further 120 h and the cytotoxicity was calculated with a cell death kit. All the experiments were performed three times at an MOI of 10 and representative data are shown (A and C). Error bars represent mean ± SEM (B). *p < 0.01 (D).
Figure 3
Figure 3
Expression of cell-surface molecules by flowcytometric analysis at 48 h after infection of CVS or ERA (MOI of 10). Profiles of the surface molecules on uninfected (control; white), CVS-infected (gray), and ERA-infected (black) JAWS II cells reacted with FITC conjugated anti-mouse MHC class I, MHC class II and CD80, PE conjugated anti-mouse CD86 and TLR3, and rat anti-mouse RIG1 antibodies, followed by a FITC-conjugated goat anti-rat IgG antibody. The relative fluorescence intensity of the surface molecules was determined with FACS. All cells including uninfected cells (control) were stained by the same procedure. The experiments were performed three times and error bars represent SEM. *p < 0.001, **p < 0.05, ***p < 0.01.
Figure 4
Figure 4
Production of IFN-α and IFN-β in CVS- and ERA-inoculated JAWS II cells. (A) The levels of IFN-α (white) and IFN-β (black) in the culture supernatant 48 h after infection in CVS- or ERA-infected JAWS II cells at various MOIs (0.5, 5, and 10). (B) Serial changes in IFN-α (dotted line) and IFN-β (black line) production in the CVS-infected (squares) and ERA-infected JAWS II cells (circles) at an MOI of 10. The levels of type I IFN were quantified by ELISA 72 h after infection. The experiments were performed three times and error bars represent SEM. *p < 0.001, **p < 0.01.
Figure 5
Figure 5
Cell-to-cell infection of RABV from JAWS II cells to neural cells. A coculture assay of NA cells (indicator cells) with CVS-infected JAWS II cells or NA cells (donor cells) was performed as described in the Methods. The expression of the viral N protein was analyzed with a laser scanning microscope. After the infection of JAWS II cells with CVS at an MOI of 10, the cells were permeabilized with IntraPrep Permeabilization Reagent, and then reacted with FITC-conjugated anti-RABV N MAb. The experiments were performed three times and representative data are shown.
Figure 6
Figure 6
Transmission of RABV to mouse brainviaJAWS II cells harboring RABV. (A) Survival rates of five-week-old C57BL/6 mice injected intracerebrally with 106, 105, or 104 CVS- or ERA-infected JAWS II cells (n = 10 each group) at MOI of 30. Their survival was observed for 14 days after the transfer of the cells. The black and dotted lines represent the survival of the mice injected with CVS- and ERA-infected JAWS II cells, respectively. The circles indicate the survival of mice injected with 106 CVS- or ERA-infected JAWS II cells. The triangles indicate the survival of mice injected with 105 CVS- or ERA-infected JAWS II cells. The crosses indicate the survival of mice injected with 104 CVS- or ERA-inoculated JAWS II cells. The experiments were performed three times. The Kaplan-Meier method was used to analyze mouse survival. Statistical analyses were performed by log-rank test. (p < 0.01; 106 CVS: 106 ERA, 105 CVS: 105 ERA. p <0.05; 104 CVS: 104 ERA) (B) Half the mice from each group were sacrificed after seven days, and the presence of viral N mRNA and RABV N protein in the hippocampal tissues was determined by RT–PCR (mRNA) and a RABV N detection kit with FITC staining, respectively. The arrow indicates the positive band of N protein on the immunochromatographic test. The upper band corresponds to nonspecific control. The experiments were performed three times as shown in Figure 1B and representative pictures are shown.

Similar articles

Cited by

References

    1. Banchereau J, Steinman RM. Dendritic cells and the control of immunity. Nature. 1998;392:245–252. doi: 10.1038/32588. - DOI - PubMed
    1. Barchet W, Cella M, Odermatt B, Asselin-Paturel C, Colonna M, Kalinke U. Virus-induced interferon alpha production by a dendritic cell subset in the absence of feedback signaling in vivo. J Exp Med. 2002;195:507–516. doi: 10.1084/jem.20011666. - DOI - PMC - PubMed
    1. Brzózka K, Finke S, Conzelmann KK. Inhibition of interferon signaling by rabies virus phosphoprotein P: activation-dependent binding of STAT1 and STAT2. J Virol 80:2675–2683 extracellular signal-regulated kinases 1 and 2. J Virol. 2006;78:9376–9388. - PMC - PubMed
    1. Charlton KM, Nadin-Davis S, Casey GA, Wandeler AI. The long incubation period in rabies: delayed progression of infection in muscle at the site of exposure. Acta Neuropathol. 1997;94:73–77. doi: 10.1007/s004010050674. - DOI - PubMed
    1. Cheng Y, King NJ, Kesson AM. Major histocompatibility complex class I (MHC-I) induction by West Nile virus: involvement of 2 signaling pathways in MHC-I up-regulation. J Infect Dis. 2004;189:658–668. doi: 10.1086/381501. - DOI - PubMed

LinkOut - more resources