

A guide for measurement of circulating metabolic hormones in rodents: Pitfalls during the pre-analytical phase
- PMID: 24024118
- PMCID: PMC3757653
- DOI: 10.1016/j.molmet.2012.07.004
A guide for measurement of circulating metabolic hormones in rodents: Pitfalls during the pre-analytical phase
Abstract
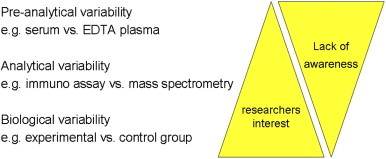
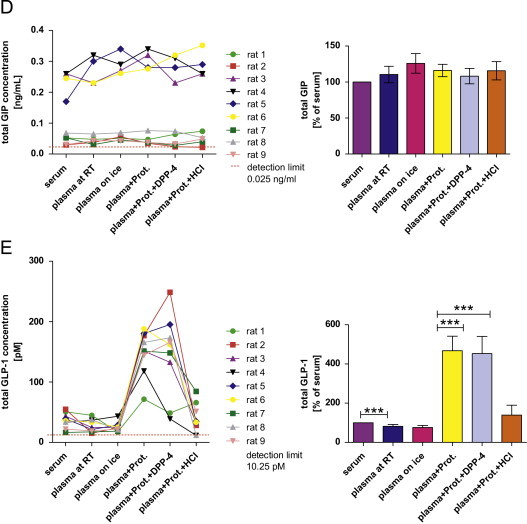
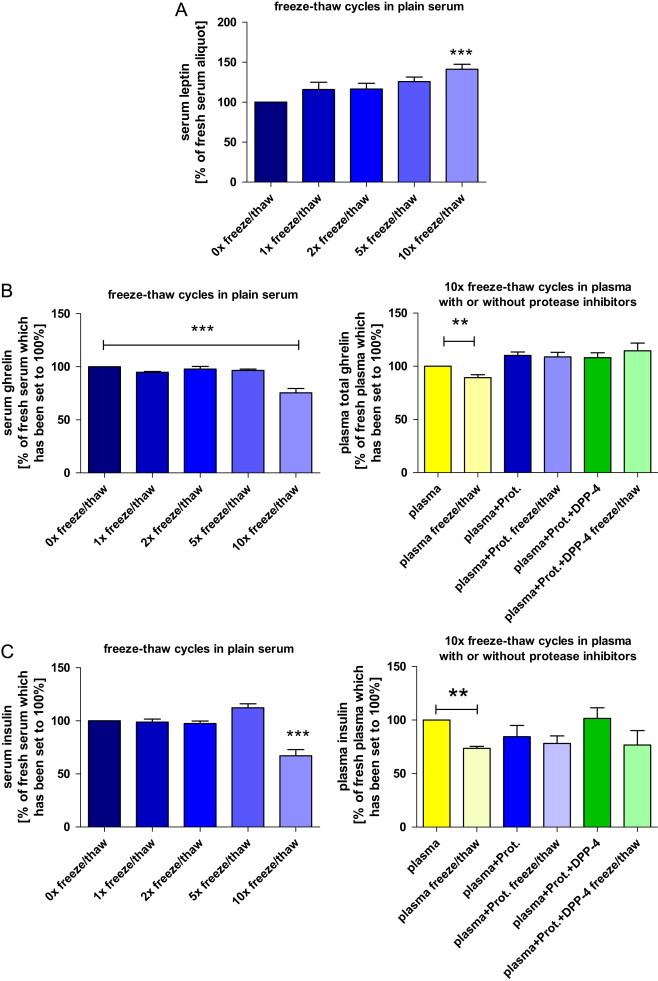
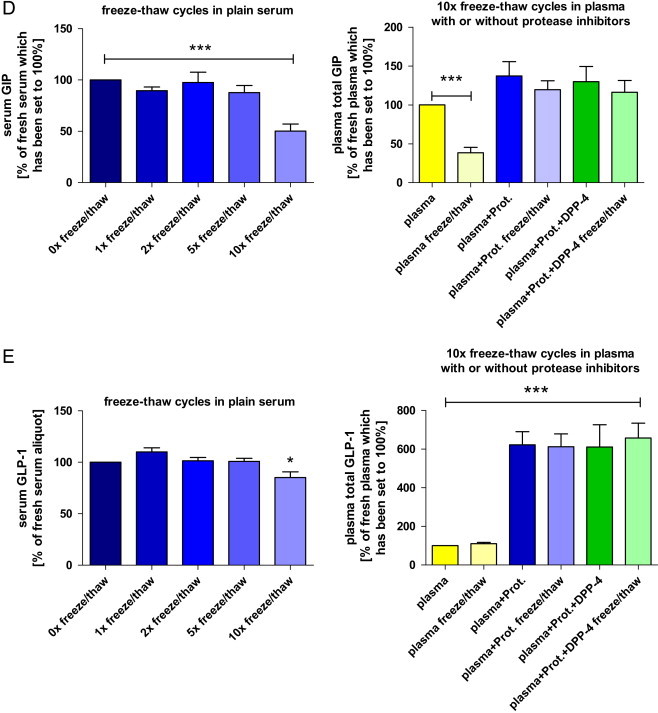
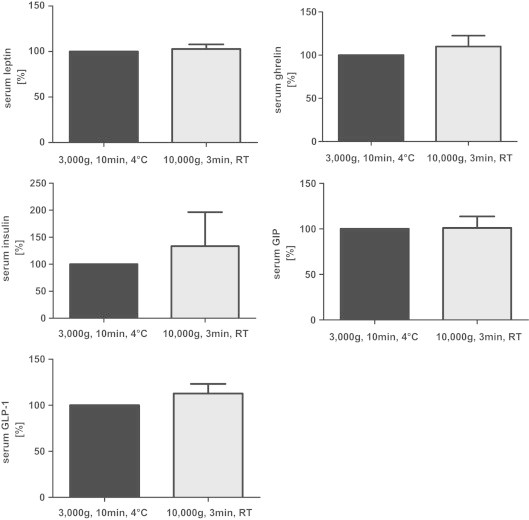
Researchers analyse hormones to draw conclusions from changes in hormone concentrations observed under specific physiological conditions and to elucidate mechanisms underlying their biological variability. It is, however, frequently overlooked that also circumstances occurring after collection of biological samples can significantly affect the hormone concentrations measured, owing to analytical and pre-analytical variability. Whereas the awareness for such potential confounders is increasing in human laboratory medicine, there is sometimes limited consensus about the control of these factors in rodent studies. In this guide, we demonstrate how such factors can affect reliability and consequent interpretation of the data from immunoassay measurements of circulating metabolic hormones in rodent studies. We also compare the knowledge about such factors in rodent studies to recent recommendations established for biomarker studies in humans and give specific practical recommendations for the control of pre-analytical conditions in metabolic studies in rodents.
Keywords: Hormone measurement; Immunoassay; Mouse; Pre-analytical variability; Rat; Sample processing.
Figures
Similar articles
-
Control of (pre)-analytical aspects in immunoassay measurements of metabolic hormones in rodents.Endocr Connect. 2018 Apr;7(4):R147-R159. doi: 10.1530/EC-18-0035. Epub 2018 Mar 14. Endocr Connect. 2018. PMID: 29540488 Free PMC article. Review.
-
Influence of pre-analytical conditions on the measurement of components of the GH/IGF axis in rats.Growth Horm IGF Res. 2013 Oct;23(5):141-8. doi: 10.1016/j.ghir.2013.05.001. Epub 2013 Jun 15. Growth Horm IGF Res. 2013. PMID: 23773927
-
Human Milk Metabolic Hormones: Analytical Methods and Current Understanding.Int J Mol Sci. 2021 Aug 13;22(16):8708. doi: 10.3390/ijms22168708. Int J Mol Sci. 2021. PMID: 34445437 Free PMC article. Review.
-
Pitfalls in the lab assessment of hypopituitarism.Rev Endocr Metab Disord. 2024 Jun;25(3):457-465. doi: 10.1007/s11154-024-09881-1. Epub 2024 Apr 13. Rev Endocr Metab Disord. 2024. PMID: 38609701 Free PMC article. Review.
-
Pre-analytical effects of blood sampling and handling in quantitative immunoassays for rheumatoid arthritis.J Immunol Methods. 2012 Apr 30;378(1-2):72-80. doi: 10.1016/j.jim.2012.02.007. Epub 2012 Feb 17. J Immunol Methods. 2012. PMID: 22366959 Free PMC article.
Cited by
-
Control of (pre)-analytical aspects in immunoassay measurements of metabolic hormones in rodents.Endocr Connect. 2018 Apr;7(4):R147-R159. doi: 10.1530/EC-18-0035. Epub 2018 Mar 14. Endocr Connect. 2018. PMID: 29540488 Free PMC article. Review.
-
Measuring myokines with cardiovascular functions: pre-analytical variables affecting the analytical output.Ann Transl Med. 2017 Aug;5(15):299. doi: 10.21037/atm.2017.07.11. Ann Transl Med. 2017. PMID: 28856139 Free PMC article. Review.
-
Agreement between fingertip-capillary and antecubital-venous appetite-related peptides.Endocr Connect. 2014 Dec;3(4):233-42. doi: 10.1530/EC-14-0110. Epub 2014 Oct 28. Endocr Connect. 2014. PMID: 25351445 Free PMC article.
-
Sustained zero-order delivery of GC-1 from a nanochannel membrane device alleviates metabolic syndrome.Int J Obes (Lond). 2016 Nov;40(11):1776-1783. doi: 10.1038/ijo.2016.129. Epub 2016 Jul 27. Int J Obes (Lond). 2016. PMID: 27460601
-
Roux-en-Y gastric bypass surgery but not vertical sleeve gastrectomy decreases bone mass in male rats.Endocrinology. 2013 Jun;154(6):2015-24. doi: 10.1210/en.2012-2130. Epub 2013 Apr 3. Endocrinology. 2013. PMID: 23554454 Free PMC article.
References
-
- Becan-McBride K. Laboratory sampling. Does the process affect the outcome? J Intraven Nurs. 1999;22:137–142. - PubMed
-
- Lippi G., Chance J.J., Church S., Dazzi P., Fontana R., Giavarina D. Preanalytical quality improvement: from dream to reality. Clin Chem Lab Med. 2011;49:1113–1126. - PubMed
-
- Plebani M. Errors in clinical laboratories or errors in laboratory medicine? Clin Chem Lab Med. 2006;44:750–759. - PubMed
-
- Bonini P., Plebani M., Ceriotti F., Rubboli F. Errors in laboratory medicine. Clin Chem. 2002;48:691–698. - PubMed
-
- Banks R.E. Preanalytical influences in clinical proteomic studies: raising awareness of fundamental issues in sample banking. Clin Chem. 2008;54:6–7. - PubMed
LinkOut - more resources
Full Text Sources
Other Literature Sources