

Oxygen dependence of nitric oxide-mediated signaling
- PMID: 24024154
- PMCID: PMC3757674
- DOI: 10.1016/j.redox.2012.11.002
Oxygen dependence of nitric oxide-mediated signaling
Abstract
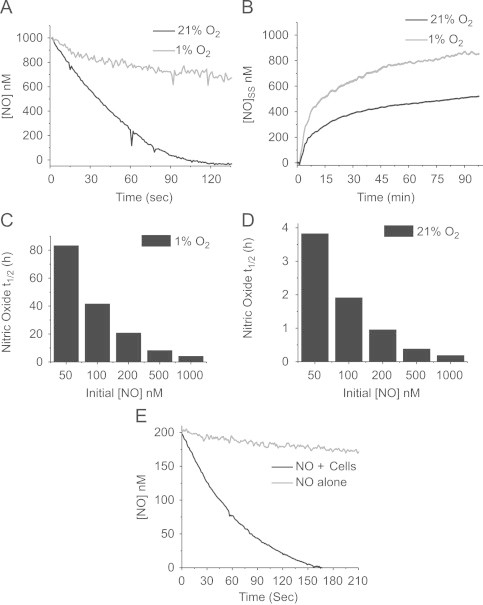
Nitric oxide (•NO) is a biologically important short-lived free radical signaling molecule. Both the enzymatic synthesis and the predominant forms of cellular metabolism of •NO are oxygen-dependent. For these reasons, changes in local oxygen concentrations can have a profound influence on steady-state •NO concentrations. Many proteins are regulated by •NO in a concentration-dependent manner, but their responses are elicited at different thresholds. Using soluble guanylyl cyclase (sGC) and p53 as model •NO-sensitive proteins, we demonstrate that their concentration-dependent responses to •NO are a function of the O2 concentration. p53 requires relatively high steady-state •NO concentrations (>600 nM) to induce its phosphorylation (P-ser-15), whereas sGC responds to low •NO concentrations (<100 nM). At a constant rate of •NO production (liberation from •NO-donors), decreasing the O2 concentration (1%) lowers the rate of •NO metabolism. This raises steady-state •NO concentrations and allows p53 activation at lower doses of the •NO donor. Enzymatic •NO production, however, requires O2 as a substrate such that decreasing the O2 concentration below the K m for O2 for nitric oxide synthase (NOS) will decrease the production of •NO. We demonstrate that the amount of •NO produced by RAW 264.7 macrophages is a function of the O2 concentration. Differences in rates of •NO production and •NO metabolism result in differential sGC activation that is not linear with respect to O2. There is an optimal O2 concentration (≈5-8%) where a balance between the synthesis and metabolism of •NO is established such that both the •NO concentration and sGC activation are maximal.
Keywords: Autooxidation; BH4, tetrahydrobiopterin; DETA/NO, (Z)-1-[N-(2-aminoethyl)–N-(2-ammonioethyl)amino]diazen-1-ium-1,2-diolate; FAD, flavin adenine dinucleotide; FMN, flavin mononucleotide; Km, Michaelis constant; LPS, lipopolysaccharide; NADPH, nicotinamide adenine dinucleotide phosphate, reduced; NO2−, nitrite; NO3−, nitrate; Nitric oxide; Nitric oxide synthase; O2, oxygen; ODQ, 1H-[1,2,4]Oxadiazolo[4,3–a]quinoxalin-1-one; Oxygen; P-Ser-15, phospho-serine 15; Sper/NO, (Z)-1-[N-[3–aminopropyl]–N-[4-(3-aminopropylammonio)butyl]-amino]diazen-1-ium-1,2-diolate; cGMP, cyclic guanosine monophosphate; eNOS, endothelial nitric oxide synthase; iNOS, inducible nitric oxide synthase; nNOS, neuronal nitric oxide synthase; p53; sGC; sGC, soluble guanylyl cyclase; •NO, nitric oxide.
Figures


Similar articles
-
Contribution of iNOS/sGC/PKG pathway, COX-2, CYP4A1, and gp91(phox) to the protective effect of 5,14-HEDGE, a 20-HETE mimetic, against vasodilation, hypotension, tachycardia, and inflammation in a rat model of septic shock.Nitric Oxide. 2013 Sep 1;33:18-41. doi: 10.1016/j.niox.2013.05.001. Epub 2013 May 14. Nitric Oxide. 2013. PMID: 23684565 Free PMC article.
-
Notch activation augments nitric oxide/soluble guanylyl cyclase signaling in immortalized ovarian surface epithelial cells and ovarian cancer cells.Cell Signal. 2013 Dec;25(12):2780-7. doi: 10.1016/j.cellsig.2013.09.008. Epub 2013 Sep 13. Cell Signal. 2013. PMID: 24041655
-
Prolonged NO treatment decreases alpha-adrenoreceptor agonist responsiveness in porcine pulmonary artery due to persistent soluble guanylyl cyclase activation.Am J Physiol Lung Cell Mol Physiol. 2009 Apr;296(4):L666-73. doi: 10.1152/ajplung.90322.2008. Epub 2009 Jan 30. Am J Physiol Lung Cell Mol Physiol. 2009. PMID: 19181745 Free PMC article.
-
Role of the nitric oxide-soluble guanylyl cyclase pathway in obstructive airway diseases.Pulm Pharmacol Ther. 2014 Oct;29(1):1-6. doi: 10.1016/j.pupt.2014.07.004. Epub 2014 Jul 17. Pulm Pharmacol Ther. 2014. PMID: 25043200 Review.
-
Regulation of nitric oxide and soluble guanylyl cyclase.Brain Res Bull. 2004 Feb 15;62(6):505-15. doi: 10.1016/S0361-9230(03)00102-3. Brain Res Bull. 2004. PMID: 15036565 Review.
Cited by
-
Circular RNA Expression: Its Potential Regulation and Function in Abdominal Aortic Aneurysms.Oxid Med Cell Longev. 2021 Jun 29;2021:9934951. doi: 10.1155/2021/9934951. eCollection 2021. Oxid Med Cell Longev. 2021. PMID: 34306317 Free PMC article. Review.
-
Nitrous oxide production and consumption by marine ammonia-oxidizing archaea under oxygen depletion.Front Microbiol. 2024 Sep 4;15:1410251. doi: 10.3389/fmicb.2024.1410251. eCollection 2024. Front Microbiol. 2024. PMID: 39296305 Free PMC article.
-
The Effect of Hyperoxia on Nitric Oxide Metabolism in the Skeletal Muscle of Male Type 2 Diabetic Rats.Endocrinol Diabetes Metab. 2025 Sep;8(5):e70090. doi: 10.1002/edm2.70090. Endocrinol Diabetes Metab. 2025. PMID: 40755371 Free PMC article.
-
Erythropoietin and a nonerythropoietic peptide analog promote aortic endothelial cell repair under hypoxic conditions: role of nitric oxide.Hypoxia (Auckl). 2016 Aug 16;4:121-133. doi: 10.2147/HP.S104377. eCollection 2016. Hypoxia (Auckl). 2016. PMID: 27800514 Free PMC article.
-
Signaling and stress: The redox landscape in NOS2 biology.Free Radic Biol Med. 2015 Oct;87:204-25. doi: 10.1016/j.freeradbiomed.2015.06.002. Epub 2015 Jun 24. Free Radic Biol Med. 2015. PMID: 26117324 Free PMC article. Review.
References
-
- Stuehr D.J., Santolini J., Wang Z.Q., Wei C.C., Adak S. Update on mechanism and catalytic regulation in the NO synthases. Journal of Biological Chemistry. 2004;279:36167–36170. - PubMed
-
- Thomas D.D., Espey M.G., Ridnour L.A., Hofseth L.J., Mancardi D., Harris C.C. Hypoxic inducible factor 1alpha, extracellular signal-regulated kinase, and p53 are regulated by distinct threshold concentrations of nitric oxide. Proceedings of the National Academy of Sciences of the USA. 2004;101:8894–8899. - PMC - PubMed
Publication types
MeSH terms
Substances
Grants and funding
LinkOut - more resources
Full Text Sources
Other Literature Sources
Molecular Biology Databases
Research Materials
Miscellaneous
