. 2013 Sep 11:13:131.
doi: 10.1186/1471-2229-13-131.

Perturbation of Brachypodium distachyon CELLULOSE SYNTHASE A4 or 7 results in abnormal cell walls

Affiliations

Perturbation of Brachypodium distachyon CELLULOSE SYNTHASE A4 or 7 results in abnormal cell walls

Pubudu P Handakumbura et al. BMC Plant Biol. .

Abstract

Background: Cellulose is an integral component of the plant cell wall and accounts for approximately forty percent of total plant biomass but understanding its mechanism of synthesis remains elusive. CELLULOSE SYNTHASE A (CESA) proteins function as catalytic subunits of a rosette-shaped complex that synthesizes cellulose at the plasma membrane. Arabidopsis thaliana and rice (Oryza sativa) secondary wall CESA loss-of-function mutants have weak stems and irregular or thin cell walls.

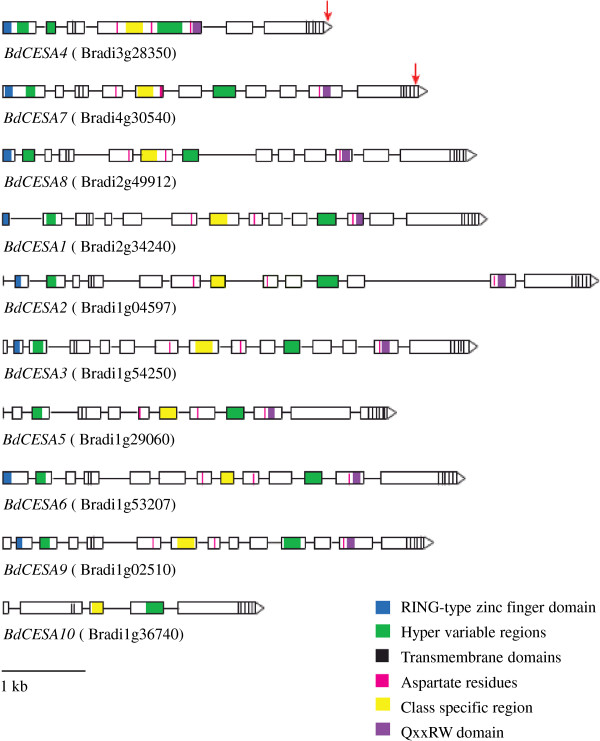
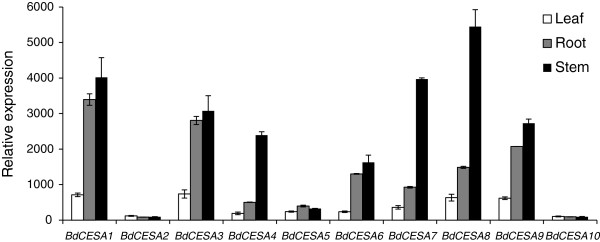
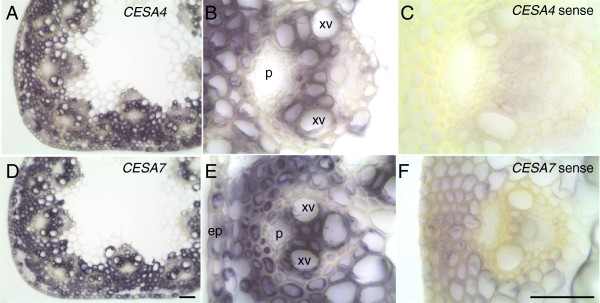
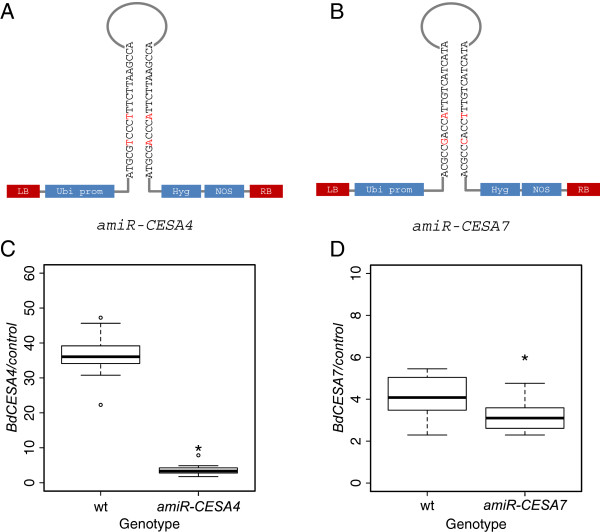
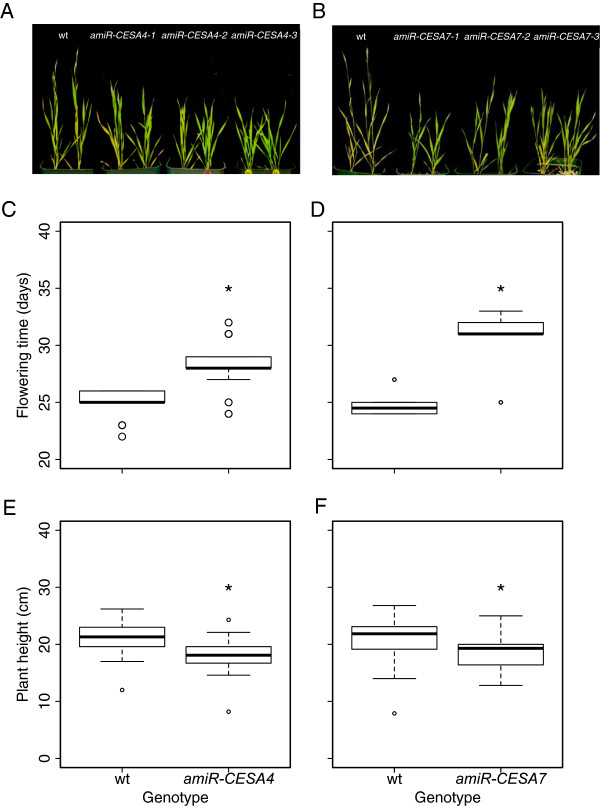
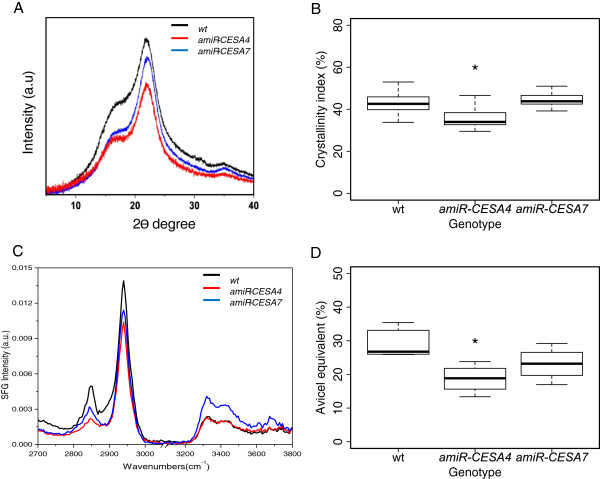
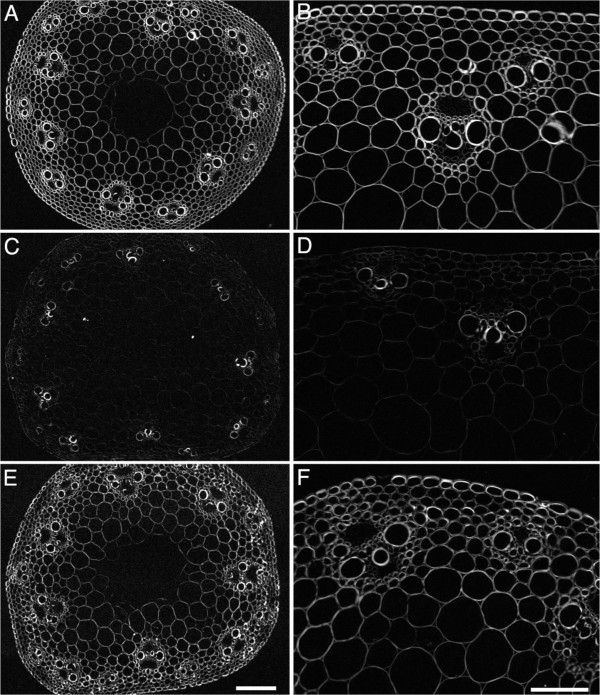
Results: Here, we identify candidates for secondary wall CESAs in Brachypodium distachyon as having similar amino acid sequence and expression to those characterized in A. thaliana, namely CESA4/7/8. To functionally characterize BdCESA4 and BdCESA7, we generated loss-of-function mutants using artificial microRNA constructs, specifically targeting each gene driven by a maize (Zea mays) ubiquitin promoter. Presence of the transgenes reduced BdCESA4 and BdCESA7 transcript abundance, as well as stem area, cell wall thickness of xylem and fibers, and the amount of crystalline cellulose in the cell wall.

Conclusion: These results suggest BdCESA4 and BdCESA7 play a key role in B. distachyon secondary cell wall biosynthesis.


Figures

Figure 1
Figure 1
Models of Brachypodium distachyon CESA genes. Exons are indicated by boxes and introns by lines. Genes are drawn to scale; the bar in the lower left indicates 1 kb. Red arrows indicate regions used for artificial microRNA targeting.
Figure 2
Figure 2
Phylogenetic analysis of CESA amino acid sequences. Numerical values on branches refer to neighbor-joining bootstrap support. Yellow oval denotes proteins associated with secondary cell walls.
Figure 3
Figure 3
Relative abundance of CESA transcripts in different organs measured with a microarray. Bars plot mean ± standard deviation of three biological replicates.
Figure 4
Figure 4
BdCESA4 and BdCESA7 are expressed in cells undergoing secondary wall deposition in the stem. Expression of CESA4(A, B) and CESA7(D, E) analyzed by in situ hybridization at three weeks of development when the inflorescence was just emerging from the flag leaf. Cross sections through the first internode were labeled with anti-sense probes, imaged at 10x (A, D) and 40x (B, E); and sense probes, imaged at 40x (C, F). xv, xylem vessel; p, phloem; ep, epidermis; Scale bar = 50 μm.
Figure 5
Figure 5
Targeting CESA expression by means of artificial microRNAs. (A, B) Schematic of the constructs used. The hairpin model illustrates the 21-mer sequence of each microRNA construct and red letters indicate the mismatch in each hairpin recognized by the DICER complex. LB, left border; Ubi prom, maize ubiquitin promoter; Hyg, hygromycin phosphotransferase gene; NOS, nopeline synthase terminator; RB, right border. (C, D) Relative levels of transcript measured by RT-QPCR. Reference genes are given in methods. Stem tissue was collected at the same development stage when inflorescence was just emerging from the flag leaf. Three to five individuals from three to four independent transgenic lines were analyzed for each construct. The boxes show interquartile range, the whiskers show the outer quartile edge, and the black line represents the median of each distribution. Open circles represent outliers, when present. * Denotes significance at the 5% level.
Figure 6
Figure 6
Whole plant phenotypes. (A, B) Plants at the time of wild-type inflorescence emergence. Representative plants of wild-type and of three independent lines used for each construct. (C, D) Days to inflorescence emergence. (E, F) Mature plant height. Twenty to thirty individuals from three independent lines were analyzed for each construct. Box plots and significance are as described for Figure 5.
Figure 7
Figure 7
Stem anatomy. (A) Toluidine blue-stained transverse sections. (B, C) Stem area. Cell wall thickness of (D, E) metaxylem and (F, G) interfascicular fibers. First internode was collected and analyzed at inflorescence immergence from developmentally equivalent plants. Three to five individuals from three independent lines were analyzed. Box plots and significance are as described for figure 5.
Figure 8
Figure 8
Spectroscopic analysis of cellulose crystallinity. (A) X-ray powder diffraction profiles. (B) Crystallinity index derived from the diffraction profiles using the amorphous cellulose subtraction method. (C) Sum-frequency-generation vibration spectra. (D) Cellulose crystallinity derived from the spectra based on comparison to Avicel. Eight to twelve individuals from three independent lines were analyzed for each transgene. Box plots and significance are as described for figure 5.
Figure 9
Figure 9
Polarized-light micrographs of stem internode transverse cross-sections. Representative images of (A, B) wild type; (C, D)amiR-CESA4; (E, F)amiR-CESA7. Left hand panels are observed through a 4x lens and a gray scale value of 255 indicates a retardance value of 5 nm; Right hand panels are observed through a 20x lens and a gray scale value of 255 indicates a retardance value of 13 nm. Bars = 50 μm (E) and 100 μm (F).

References

    1. Heaton EA, Flavell RB, Mascia PN, Thomas SR, Dohleman FG, Long SP. Herbaceous energy crop development: recent progress and future prospects. Curr Opin Biotechnol. 2008;19:202. doi: 10.1016/j.copbio.2008.05.001. - DOI - PubMed
    1. Brkljacic J, Grotewold E, Scholl R, Mockler T, Garvin DF, Vain P, Brutnell T, Sibout R, Bevan M, Budak H. et al.Brachypodium as a model for the grasses: today and the future. Plant Physiol. 2011;157(1):3–13. doi: 10.1104/pp.111.179531. - DOI - PMC - PubMed
    1. Bragg JN, Wu J, Gordon SP, Guttman ME, Thilmony R, Lazo GR, Gu YQ, Vogel JP. Generation and characterization of the Western Regional Research Center Brachypodium T-DNA insertional mutant collection. PLoS ONE. 2012;7(9):e41916. doi: 10.1371/journal.pone.0041916. - DOI - PMC - PubMed
    1. d'Yvoire MB, Bouchabke-Coussa O, Voorend W, Antelme S, Cézard L, Legée F, Lebris P, Legay S, Whitehead C, McQueen-Mason SJ. et al.Disrupting the cinnamyl alcohol dehydrogenase 1 gene (BdCAD1) leads to altered lignification and improved saccharification in Brachypodium distachyon. Plant J. 2012;73:496–508. - PubMed
    1. International Brachypodium Initiative. Genome sequencing and analysis of the model grass Brachypodium distachyon. Nature. 2010;463(7282):763–768. doi: 10.1038/nature08747. - DOI - PubMed

Publication types

MeSH terms