

RRM1 and RRM2 pharmacogenetics: association with phenotypes in HapMap cell lines and acute myeloid leukemia patients
- PMID: 24024897
- PMCID: PMC3860742
- DOI: 10.2217/pgs.13.131
RRM1 and RRM2 pharmacogenetics: association with phenotypes in HapMap cell lines and acute myeloid leukemia patients
Abstract
Background: Ribonucleotide reductase catalyzes an essential step in the cellular production of deoxyribonucleotide triphosphates and has been associated with clinical outcome in cancer patients receiving nucleoside analog-based chemotherapy.
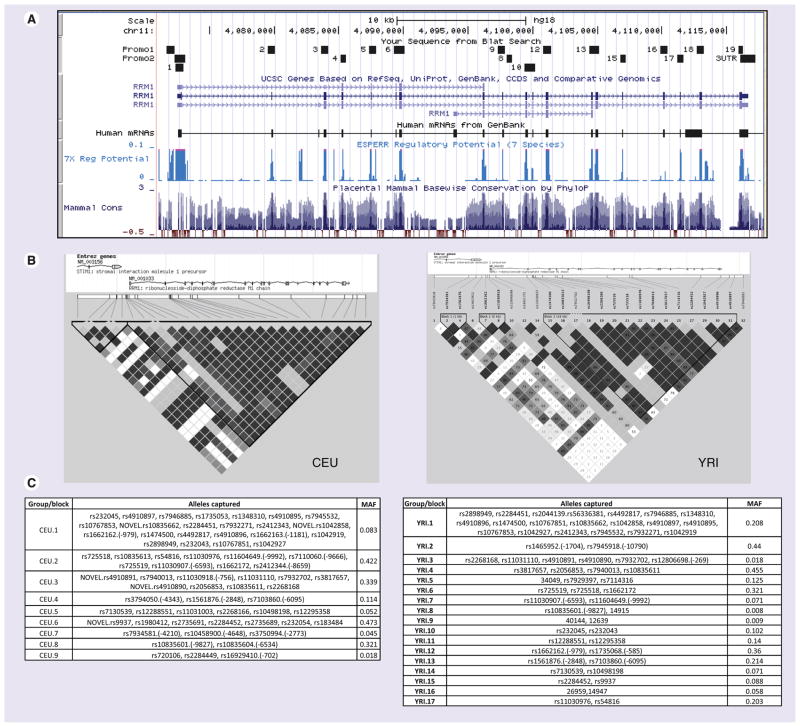
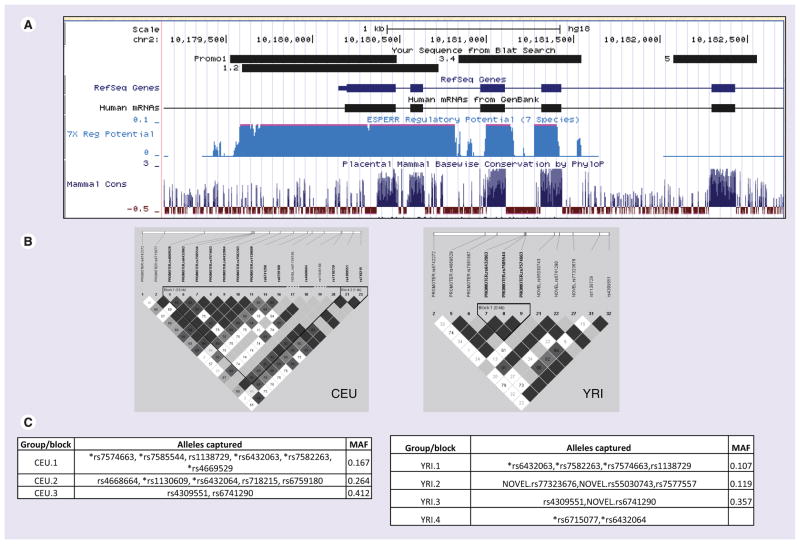
Materials & methods: In the current study, we sequenced the genes RRM1 and RRM2 in genomic DNA from HapMap cell lines with European (Utah residents with northern and western European ancestry [CEU]; n = 90) or African (Yoruba people in Ibadan, Nigeria [YRI]; n = 90) ancestry.
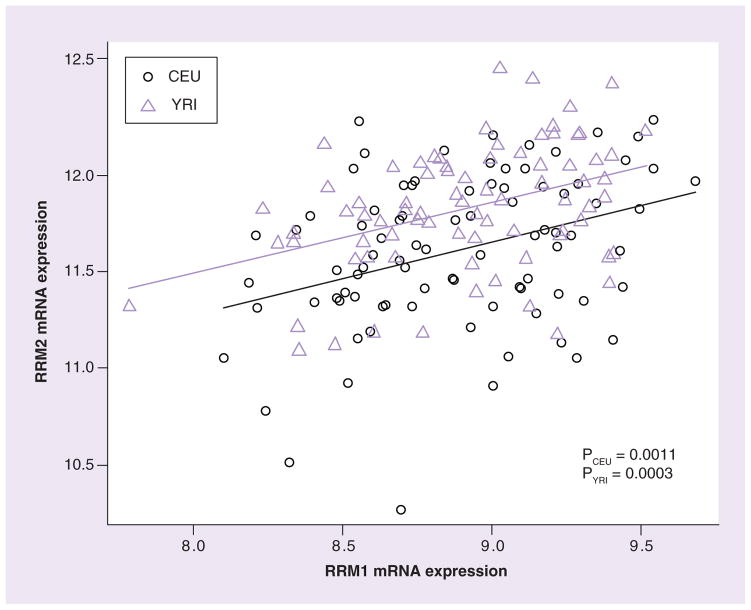
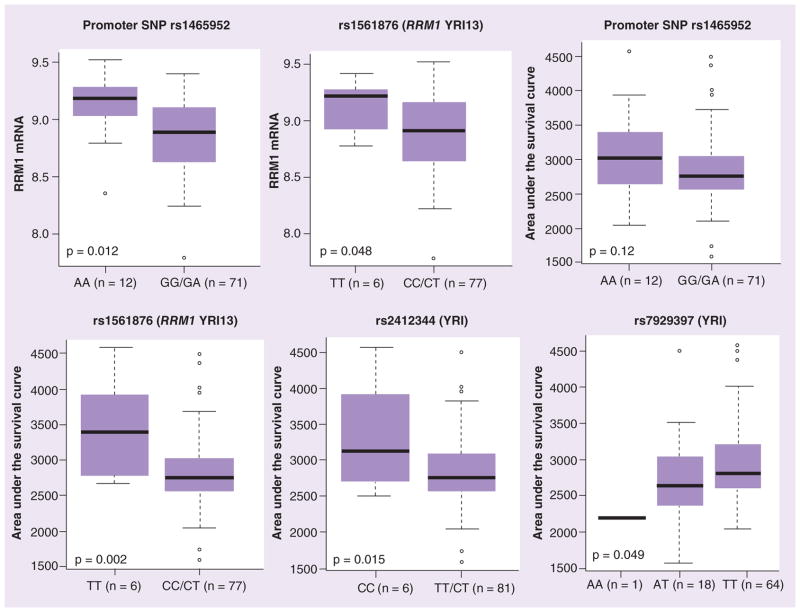
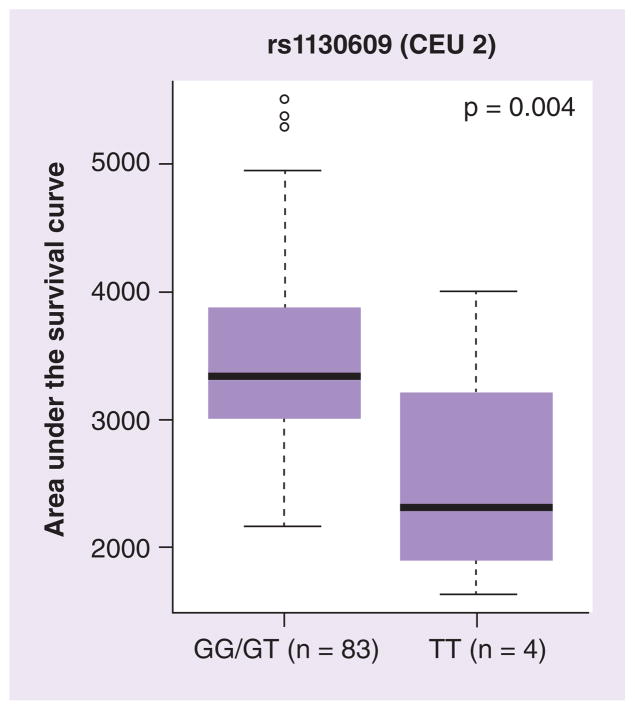
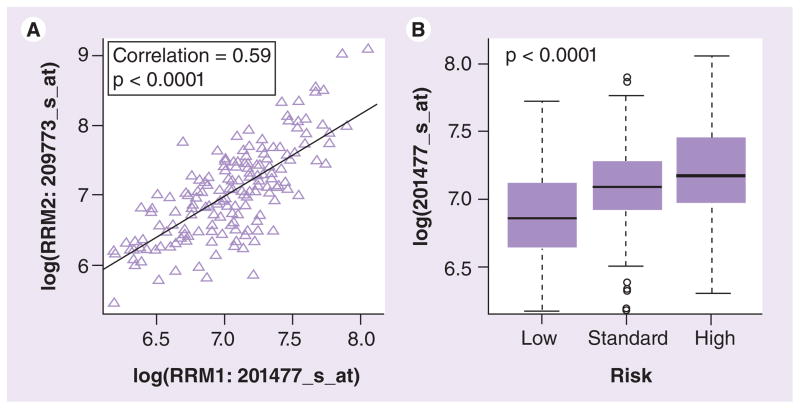
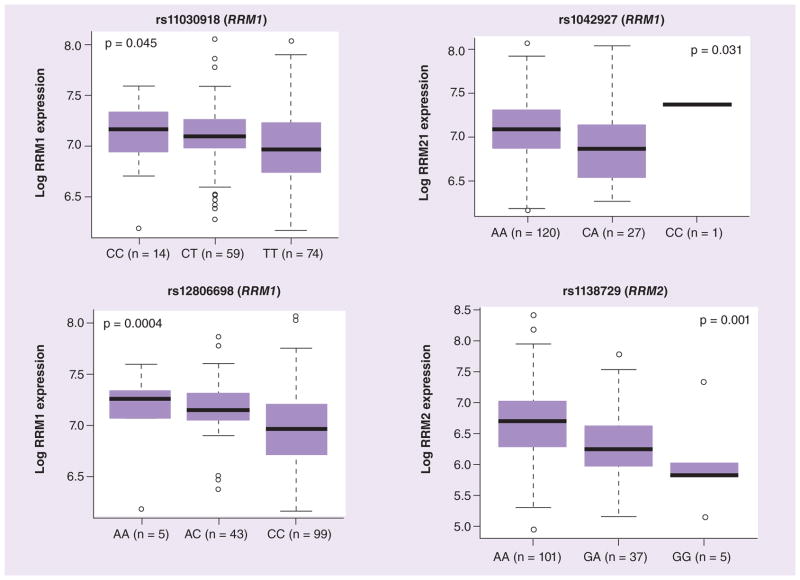
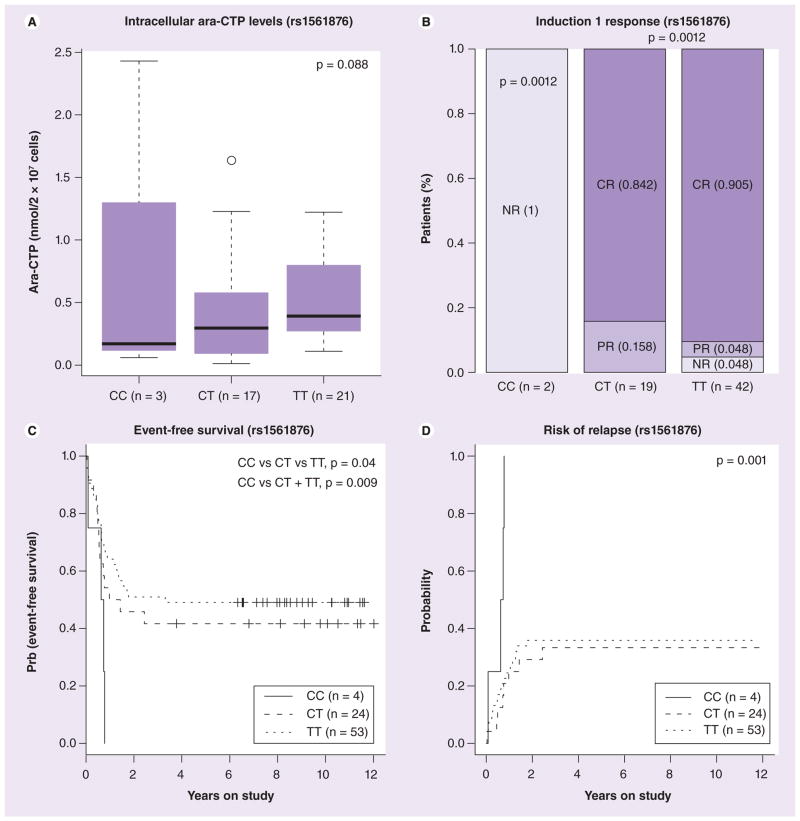
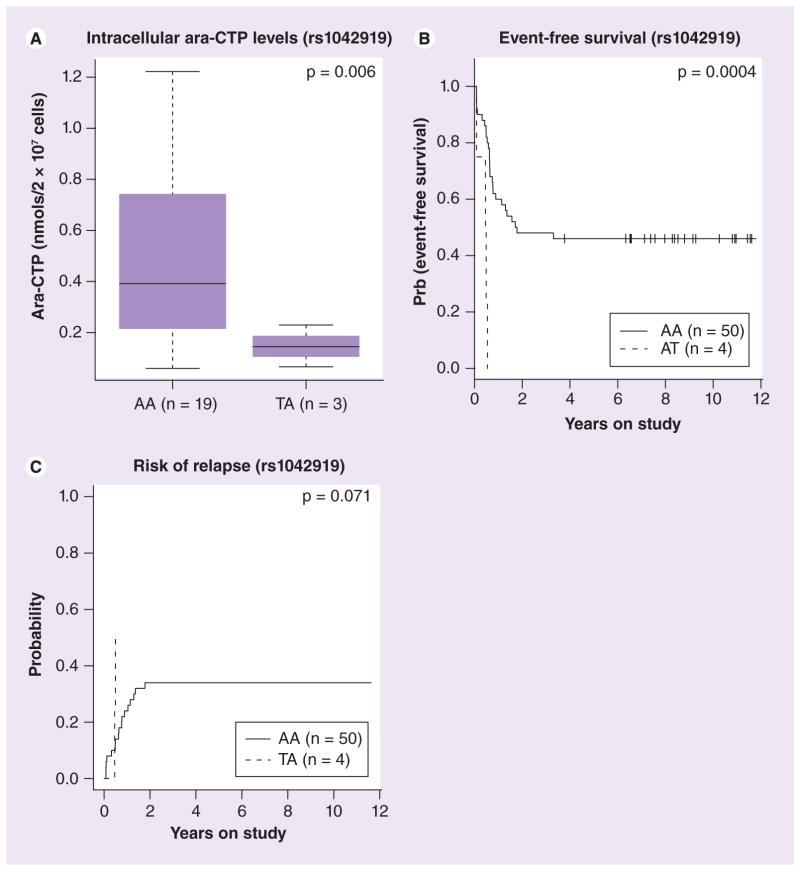
Results: We identified 44 genetic variants including eight coding SNPs in RRM1 and 15 SNPs including one coding SNP in RRM2. RRM1 and RRM2 mRNA expression levels were significantly correlated with each other in both CEU and YRI lymphoblast cell lines, and in leukemic blasts from acute myeloid leukemia (AML) patients (AML97, n = 89; AML02, n = 187). Additionally, RRM1 expression was higher among patient features indicative of a high relapse hazard. We evaluated SNPs within the RRM1 and RRM2 genes in the HapMap lymphoblast cell lines from CEU and YRI panels for association with expression and cytarabine chemosensitivity. SNPs of potential significance were further evaluated in AML patients. RRM1 SNPs rs1042919 (which occurs in linkage disequilbrium with multiple other SNPs) and promoter SNP rs1561876 were associated with intracellular 1-β-D-arabinofuranosyl-CTP levels, response after remission induction therapy, risk of relapse and overall survival in AML patients receiving cytarabine and cladribine.
Conclusion: These results suggest that SNPs within ribonucleotide reductase might be helpful predictive markers of response to nucleoside analogs and should be further validated in larger cohorts.
Figures
Similar articles
-
Genetic variants in cytosolic 5'-nucleotidase II are associated with its expression and cytarabine sensitivity in HapMap cell lines and in patients with acute myeloid leukemia.J Pharmacol Exp Ther. 2011 Oct;339(1):9-23. doi: 10.1124/jpet.111.182873. Epub 2011 Jun 28. J Pharmacol Exp Ther. 2011. PMID: 21712425 Free PMC article.
-
Pharmacogenetics of deoxycytidine kinase: identification and characterization of novel genetic variants.J Pharmacol Exp Ther. 2007 Dec;323(3):935-45. doi: 10.1124/jpet.107.128595. Epub 2007 Sep 12. J Pharmacol Exp Ther. 2007. PMID: 17855478
-
Association of genetic polymorphisms in genes involved in Ara-C and dNTP metabolism pathway with chemosensitivity and prognosis of adult acute myeloid leukemia (AML).J Transl Med. 2018 Apr 10;16(1):90. doi: 10.1186/s12967-018-1463-1. J Transl Med. 2018. PMID: 29631596 Free PMC article.
-
Genetic factors influencing cytarabine therapy.Pharmacogenomics. 2009 Oct;10(10):1657-74. doi: 10.2217/pgs.09.118. Pharmacogenomics. 2009. PMID: 19842938 Free PMC article. Review.
-
Cladribine in the remission induction of adult acute myeloid leukemia: where do we stand?Ann Hematol. 2019 Mar;98(3):561-579. doi: 10.1007/s00277-018-3562-8. Epub 2018 Nov 23. Ann Hematol. 2019. PMID: 30470874 Review.
Cited by
-
Genetic polymorphisms as potential pharmacogenetic biomarkers for platinum-based chemotherapy in non-small cell lung cancer.Mol Biol Rep. 2024 Jan 13;51(1):102. doi: 10.1007/s11033-023-08915-2. Mol Biol Rep. 2024. PMID: 38217759 Review.
-
Therapeutic Value of Single Nucleotide Polymorphisms on the Efficacy of New Therapies in Patients with Multiple Sclerosis.J Pers Med. 2021 Apr 23;11(5):335. doi: 10.3390/jpm11050335. J Pers Med. 2021. PMID: 33922540 Free PMC article. Review.
-
RNA expression of genes involved in cytarabine metabolism and transport predicts cytarabine response in acute myeloid leukemia.Pharmacogenomics. 2015 Jul;16(8):877-90. doi: 10.2217/pgs.15.44. Epub 2015 Jun 17. Pharmacogenomics. 2015. PMID: 26083014 Free PMC article.
-
Phase I study of ADI-PEG20 plus low-dose cytarabine for the treatment of acute myeloid leukemia.Cancer Med. 2021 May;10(9):2946-2955. doi: 10.1002/cam4.3871. Epub 2021 Mar 30. Cancer Med. 2021. PMID: 33787078 Free PMC article. Clinical Trial.
-
4'-Ethynyl-2'-Deoxycytidine (EdC) Preferentially Targets Lymphoma and Leukemia Subtypes by Inducing Replicative Stress.Mol Cancer Ther. 2024 May 2;23(5):683-699. doi: 10.1158/1535-7163.MCT-23-0487. Mol Cancer Ther. 2024. PMID: 38064712 Free PMC article.
References
-
- Liliemark JO, Plunkett W. Regulation of 1-β-D-arabinofuranosylcytosine 5′-triphosphate accumulation in human leukemia cells by deoxycytidine 5′-triphosphate. Cancer Res. 1986;46(3):1079–1083. - PubMed
-
- Chabner BA, Hande KR, Drake JC. Ara-C Metabolism: implications for drug resistance and drug interactions. Bull Cancer. 1979;66(1):89–92. - PubMed
-
- Chiba P, Tihan T, Szekeres T, et al. Concordant changes of pyrimidine metabolism in blasts of two cases of acute myeloid leukemia after repeated treatment with ara-C in vivo. Leukemia. 1990;4(11):761–765. - PubMed
-
- Tattersall MH, Ganeshaguru K, Hoffbrand AV. Mechanisms of resistance of human acute leukaemia cells to cytosine arabinoside. Br J Haematol. 1974;27(1):39–46. - PubMed
-
- Meuth M. The molecular basis of mutations induced by deoxyribonucleoside triphosphate pool imbalances in mammalian cells. Exp Cell Res. 1989;181(2):305–316. - PubMed
Websites
-
- International HapMap Project. www.HapMap.org.
-
- UCSC Genome Bioinformatics. http://genome.ucsc.edu.
-
- HapMap Data Rel 28. http://hapmap.ncbi.nlm.nih.gov/cgi-perl/gbrowse/hapmap28_B36.
-
- Gene Expression Omnibus. http://www.ncbi.nlm.nih.gov/geo.
Publication types
MeSH terms
Substances
Grants and funding
LinkOut - more resources
Full Text Sources
Other Literature Sources
Medical
Molecular Biology Databases
Miscellaneous