. 2013 Sep 11:6:366.
doi: 10.1186/1756-0500-6-366.

Optimising parameters for the differentiation of SH-SY5Y cells to study cell adhesion and cell migration

Affiliations

Optimising parameters for the differentiation of SH-SY5Y cells to study cell adhesion and cell migration

Susan Dwane et al. BMC Res Notes. .

Abstract

Background: Cell migration is a fundamental biological process and has an important role in the developing brain by regulating a highly specific pattern of connections between nerve cells. Cell migration is required for axonal guidance and neurite outgrowth and involves a series of highly co-ordinated and overlapping signalling pathways. The non-receptor tyrosine kinase, Focal Adhesion Kinase (FAK) has an essential role in development and is the most highly expressed kinase in the developing CNS. FAK activity is essential for neuronal cell adhesion and migration.

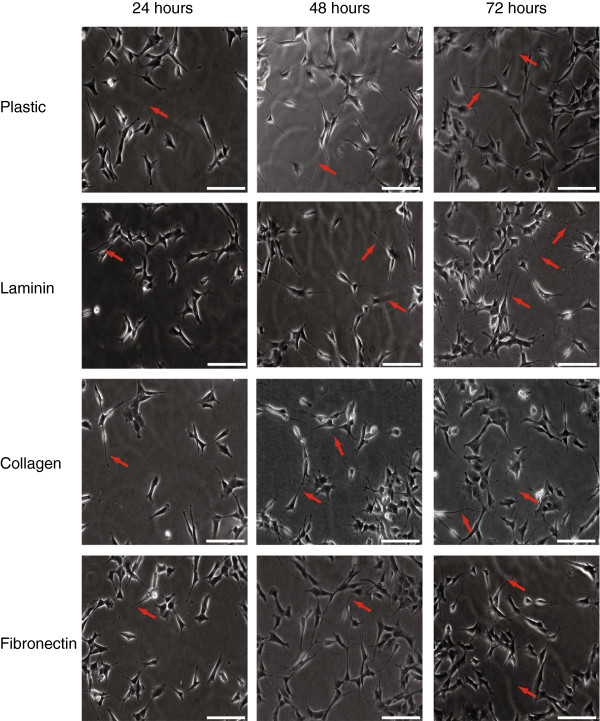
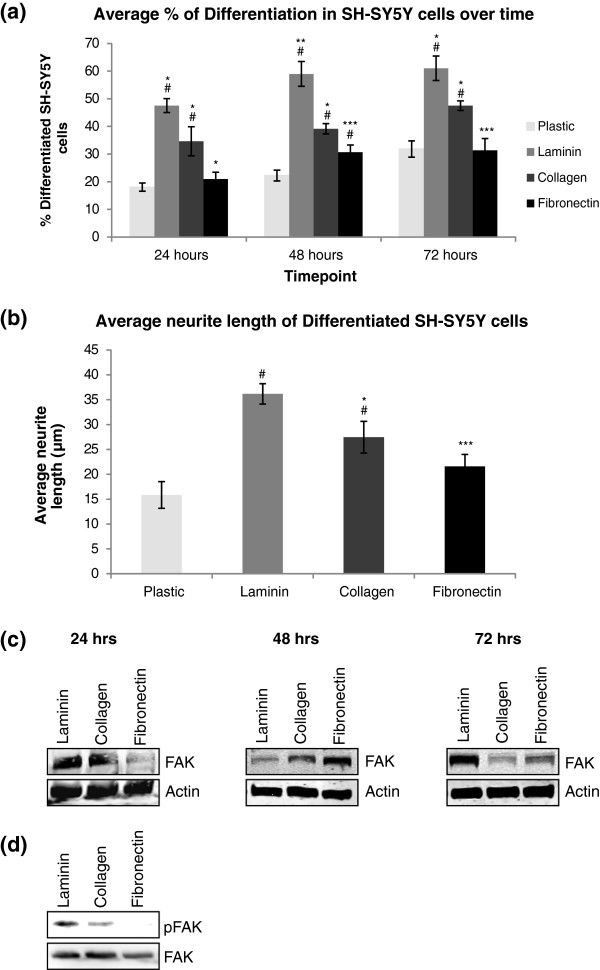
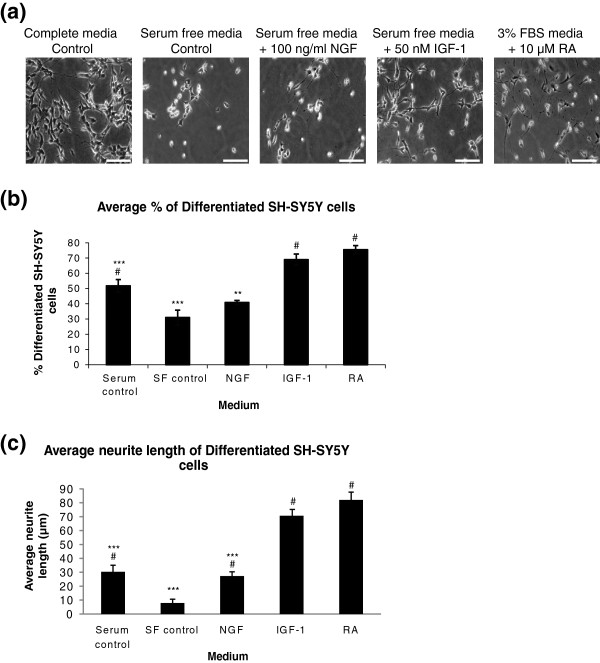
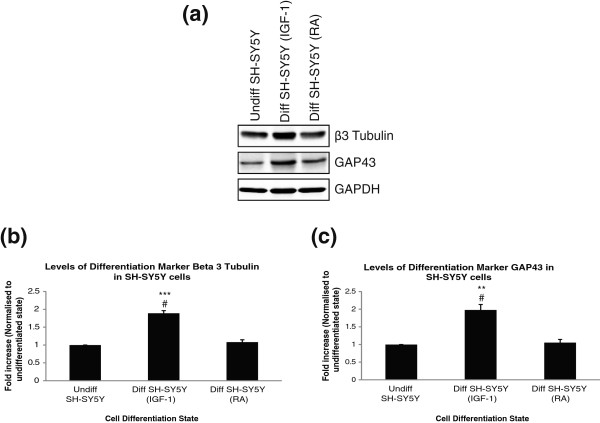
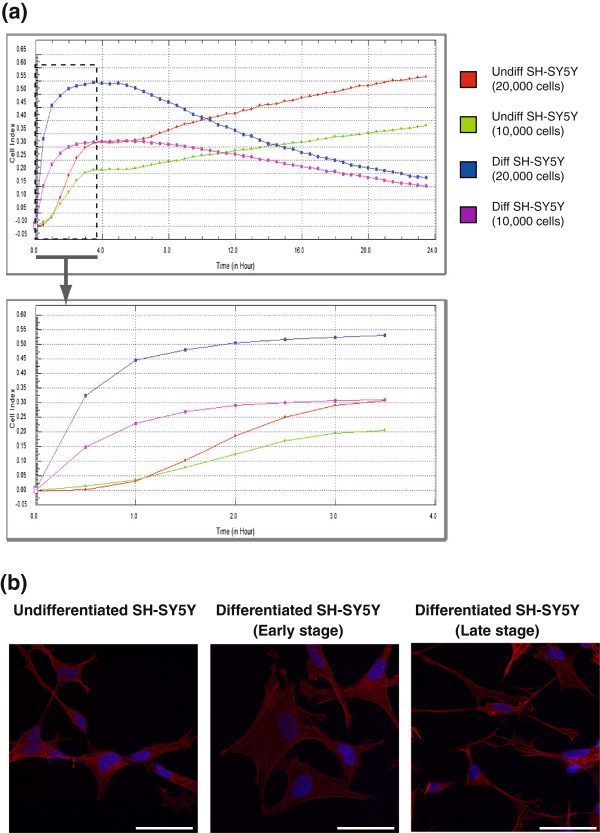
Results: The objective of this study was to optimise a protocol for the differentiation of the neuroblastoma cell line, SH-SY5Y. We determined the optimal extracellular matrix proteins and growth factor combinations required for the optimal differentiation of SH-SY5Y cells into neuronal-like cells and determined those conditions that induce the expression of FAK. It was confirmed that the cells were morphologically and biochemically differentiated when compared to undifferentiated cells. This is in direct contrast to commonly used differentiation methods that induce morphological differentiation but not biochemical differentiation.

Conclusions: We conclude that we have optimised a protocol for the differentiation of SH-SY5Y cells that results in a cell population that is both morphologically and biochemically distinct from undifferentiated SH-SY5Y cells and has a distinct adhesion and spreading pattern and display extensive neurite outgrowth. This protocol will provide a neuronal model system for studying FAK activity during cell adhesion and migration events.


Figures

Figure 1
Figure 1
Optimisation of matrices for differentiation of SH-SY5Y cells. SH-SY5Y cells were plated on 6 well plates uncoated (plastic) or coated with 10 μg/ml of laminin, collagen or fibronectin. Cells were incubated in regular DMEM media containing 10% FBS for 24, 48 or 72 hours. Pictures were taken at 20× using Metamorph software. Scale bar = 20 μm.
Figure 2
Figure 2
Quantitative analysis of neurite outgrowth behaviour on different substrates. (a) SH-SY5Y cells were plated on uncoated (plastic) or surfaces coated with 10 μg/ml of different ECM proteins: laminin, collagen or fibronectin. Cells were incubated in regular DMEM media containing 10% FBS for 24, 48 or 72 hours. Cells were counted from each condition at each timepoint and the number of differentiated cells was expressed as a percentage of the total cells counted ± SEM, n = 3. (b) The length of the neurites extending from the SH-SY5Y cells after 72 hours differentiation were measured and the average length for each matrix was expressed in a graph ± SEM, n = 3. Significant differences were measured by ANOVA (#P < 0.05 for comparisons between ECM protein-coated substrates and plastic; *P < 0.05 for comparisons between the coated substrates, Collagen vs. Laminin, Laminin vs Fibronectin or Collagen vs. Fibronectin). (c) Cells were lysed at each timepoint and run on 12% SDS-PAGE gels and probed for focal adhesion kinase (FAK), followed by detection with LI-COR Odyssey™, to monitor effect of matrices and time on protein levels. (d) To monitor the effect of the matrices on total FAK phosphorylation, cells were grown on each of the matrices for 24 hours before lysing. FAK was immunoprecipitated and the immunoprecipitate was run on 12% SDS-PAGE gel and probed for phospho-tyrosine and FAK followed by detection using the LI-COR Odyssey™ infrared image scanner.
Figure 3
Figure 3
Optimisation of growth factor media for differentiation of SH-SY5Y cells. (a) SH-SY5Y cells were plated on 6 well plates coated with laminin and incubated in regular DMEM media containing 10% FBS (Complete media Control), serum free DMEM (Serum free media Control), serum free media containing 100 nM NGF, serum free media containing 50 nM IGF-1 or DMEM containing 3% FBS and 10 μM RA for 72 hours. Pictures were taken using Metamorph software. Scale bar = 50 μm (b) Cells were counted from each condition and the number of differentiated cells was expressed as a percentage of the total cells counted ± SEM, n = 3. (c) The length of the neurites extending from the SH-SY5Y cells after 72 hours differentiation were measured and the average length for each media was expressed in a graph ± SEM, n = 3. Significant differences were measured by ANOVA (#P < 0.05 for comparisons between serum free media and all other treatments; *P < 0.05 for comparisons between RA media and all other treatments.
Figure 4
Figure 4
Confirmation of biochemical differentiation of SH-SY5Y. (a) Lysates of SH-SY5Y cells, undifferentiated or differentiated with IGF-1 or RA were run on 12% SDS-PAGE gels and probed for differentiation marker proteins, β3 tubulin and GAP43, followed by detection with LI-COR Odyssey™. Densitometry of protein bands was measured using LI-COR Odyssey™ software and normalised to cellular GAPDH levels. (b) The fold increase in β3 tubulin signal compared to undifferentiated protein level are plotted on a bar chart ± SEM, n = 3. (c) The fold increase in GAP43 signal compared to undifferentiated protein level are plotted on a bar chart ± SEM, n = 3. Significant differences were measured by ANOVA (#P < 0.05 for comparisons between undifferentiated cells and both differentiation conditions; *P < 0.05 for comparisons between RA differentiated cells and IGF-1 differentiated cells.
Figure 5
Figure 5
Confirmation of differentiation parameters for SH-SY5Y cells. (a) SH-SY5Y cells were plated at concentrations of 10,000 cells or 20,000 cells per well in an xCELLigence E-plate (ROCHE) in regular DMEM media containing 10% FBS (undifferentiated cells) or in serum free DMEM containing 50 nM IGF-1 (differentiated cells). The xCELLigence system measures changes in impedance as cells attach with a readout given as cell index (CI) value. The baseline impedance is recorded using control wells containing DMEM only with no cells. Graph representative of duplicate wells and shows adhesion and proliferation over 24 hours, n = 2. A zoomed area of the first 3.5 hours shows differentiated cells attach earlier and are larger but do not proliferate. (b) SH-SY5Y cells were plated on laminin-coated glass coverslips and incubated in regular DMEM media containing 10% FBS (undifferentiated cells) or in serum free DMEM containing 50 nM IGF-1 (differentiated cells). Cells were fixed with 4% PFA, permeabilised with PHEM/0.1% Triton X, blocked with PHEM/5% goat serum. The actin cytoskeleton was stained with TRITC-phalloidin (red) and the nuclei were stained with Hoechst 33242 (blue). All images were acquired sequentially at 63× and images merged using ImageJ. Scale bar = 20 μm. Early stage differentiated cells are larger than undifferentiated cells but cell body size decreases as neurites extend in late stage differentiation. This supports the pattern seen in the xCELLigence graph.
Figure 6
Figure 6
(a) Immunofluorescent staining of activated FAK in SH-SY5Y cells. SH-SY5Y cells were plated on laminin coated coverslips in complete DMEM (undifferentiated) or differentiated in serum free DMEM with IGF-1 for 72 hours. Cells were fixed in 4% paraformaldehyde, permeabilised in PHEM/0.1% Triton X and blocked in PHEM/5% goat serum. Cells were stained with either pFAK Y397 or pFAK Y925 (red) and the nuclei were stained with Hoechst 33242 (blue). All images were acquired sequentially at 63× and images merged using ImageJ. Scale bar = 20 μm. (b) FAK was immunoprecipitated from lysates of SH-SY5Y cells, undifferentiated or differentiated with IGF-1 and run on 12% SDS-PAGE gels and probed for phospho-tyrosine and FAK, followed by detection with LI-COR Odyssey™. Densitometry of protein bands was measured using LI-COR Odyssey™ software and normalised to undifferentiated levels. The fold increase in pFAK signal compared to undifferentiated protein level are plotted on a bar chart ± SEM, n = 3.

References

    1. Hatten ME. Central nervous system neuronal migration. Annu Rev Neurosci. 1999;22:511–539. doi: 10.1146/annurev.neuro.22.1.511. - DOI - PubMed
    1. Marin O, Rubenstein JL. Cell migration in the forebrain. Annu Rev Neurosci. 2003;26:441–483. doi: 10.1146/annurev.neuro.26.041002.131058. - DOI - PubMed
    1. Marin O, Valiente M, Ge X, Tsai LH. Guiding neuronal cell migrations. Cold Spring Harb Perspect Biol. 2010;2(2):a001834. doi: 10.1101/cshperspect.a001834. - DOI - PMC - PubMed
    1. Ghashghaei HT, Lai C, Anton ES. Neuronal migration in the adult brain: are we there yet? Nat Rev Neurosci. 2007;8(2):141–151. doi: 10.1038/nrn2074. - DOI - PubMed
    1. Hansen SM, Berezin V, Bock E. Signaling mechanisms of neurite outgrowth induced by the cell adhesion molecules NCAM and N-cadherin. Cell Mol Life Sci. 2008;65(23):3809–3821. doi: 10.1007/s00018-008-8290-0. - DOI - PMC - PubMed

Publication types

MeSH terms