. 2013 Oct;10(10):1623-30.
doi: 10.4161/rna.26214. Epub 2013 Sep 4.

4-thiouridine inhibits rRNA synthesis and causes a nucleolar stress response

Affiliations

4-thiouridine inhibits rRNA synthesis and causes a nucleolar stress response

Kaspar Burger et al. RNA Biol. 2013 Oct.

Abstract

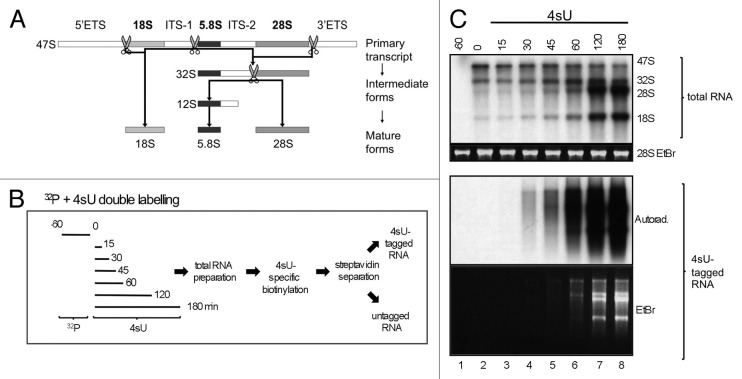
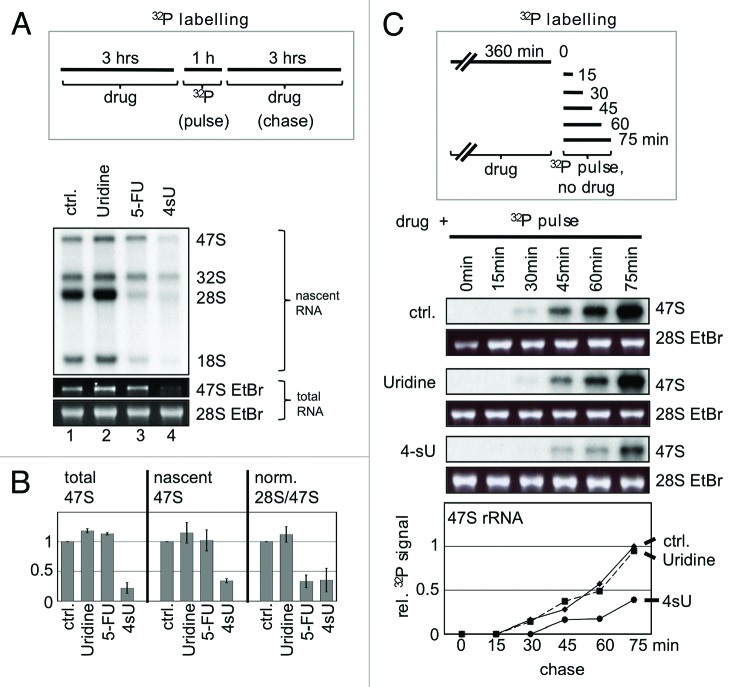
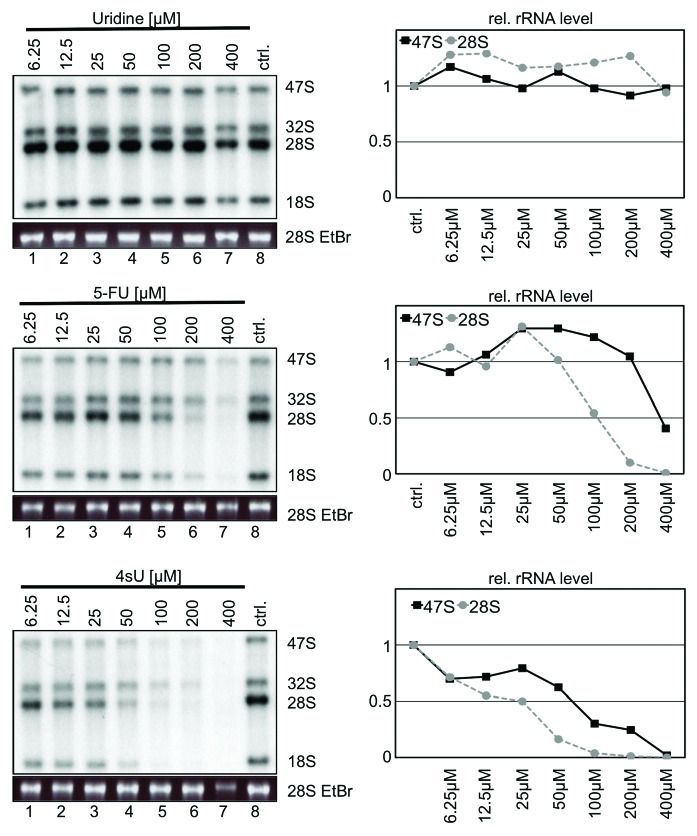
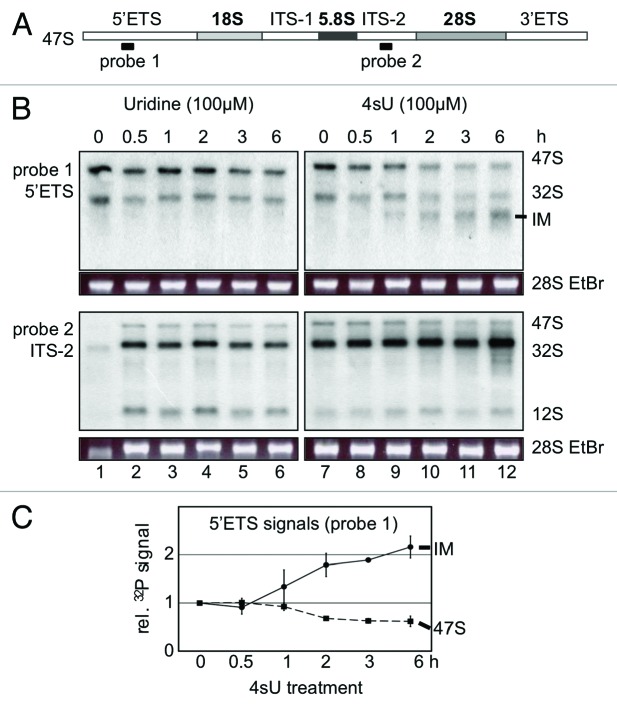
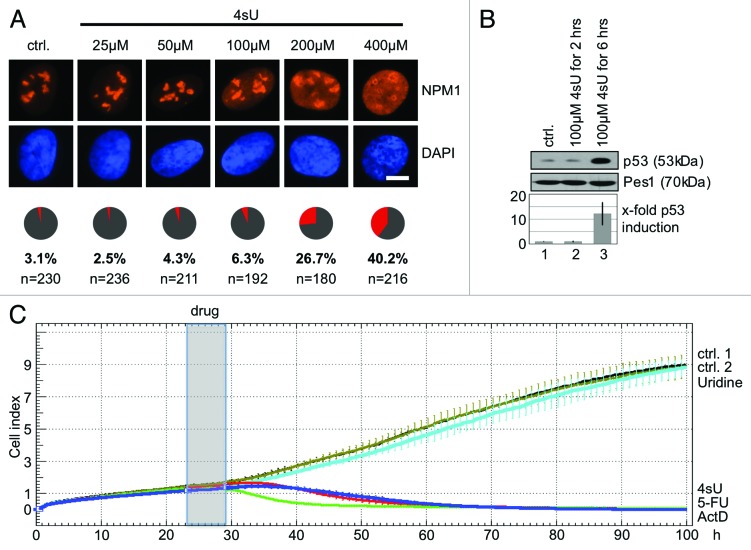
High concentrations (> 100 µM) of the ribonucleoside analog 4-thiouridine (4sU) is widely used in methods for RNA analysis like photoactivatable-ribonucleoside-enhanced crosslinking and immunoprecipitation (PAR-CLIP) and nascent messenger (m)RNA labeling (4sU-tagging). Here, we show that 4sU-tagging at low concentrations ≤ 10 µM can be used to measure production and processing of ribosomal (r)RNA. However, elevated concentrations of 4sU (> 50 µM), which are usually used for mRNA labeling experiments, inhibit production and processing of 47S rRNA. The inhibition of rRNA synthesis is accompanied by nucleoplasmic translocation of nucleolar nucleophosmin (NPM1), induction of the tumor suppressor p53, and inhibition of proliferation. We conclude that metabolic labeling of RNA by 4sU triggers a nucleolar stress response, which might influence the interpretation of results. Therefore, functional ribosome biogenesis, nucleolar integrity, and cell cycle should be addressed in 4sU labeling experiments.

Keywords: 4-thiouridine; RNA labeling; nucleolar stress; nucleophosmin; p53; rRNA processing; ribosomal RNA.


Figures

None
Figure 1. Analysis of rRNA synthesis by 4sU-tagging. (A) Transcription and processing of rRNA. The polycistronic transcription unit encodes a 47S precursor rRNA containing 5′ and 3′ external transcribed spacers (5′ETS, 3′ETS), internal transcribed spacers 1 and 2 (ITS-1, ITS-2), and 18S, 5.8S, and 28S rRNAs. The 47S rRNA undergoes a cascade of endonucleolytic cleavages (scissors) and exonucleolytic degradation steps. (B) Metabolic in vivo double-labeling workflow. 2fTGH cells were pre-labeled with [32P]-ortho-phosphate for one hour, 4sU (10 µM) was added as indicated, total RNA was prepared, 4sU-tagged RNA was biotinylated and separated from untagged RNA by streptavidin-coated magnetic beads. (C) Comparison of 32P labeling and 4sU-tagging approaches for the analysis of rRNA synthesis. 2fTGH cells were seeded and cultured overnight. Nascent RNA was prepared as indicated in (B). Total or 4sU tagged RNA was separated by agarose gel electrophoresis and analyzed by autoradiography and ethidium bromide (EtBr) staining. 28S rRNA EtBr signals serve as loading control in this and subsequent experiments. A representative of two experiments is shown.
None
Figure 2. Inhibition of rRNA production and processing by 4sU treatment. (A) U2OS cells were treated with uridine (100 μM), 5-FU (100 µM), or 4sU (100 µM) and nascent RNA was labeled by [32P]-ortho-phosphate as indicated. Total RNA was purified and analyzed as described in Materials and Methods. Nascent RNA was visualized by autoradiography, total RNA was visualized by ethidium bromide (EtBr) staining under UV-light. A representative of four experiments is shown. (B) Quantitation of nascent and total RNA levels from A. rRNA signals and ratios were measured by PhosphorImager or AIDA and plotted relative to signals from control cells (0.1% DMSO). Error bars: Standard deviation (n = 4). (C) U2OS cells were treated with drugs (100 µM), and nascent RNA was pulse-labeled by [32P]-ortho-phosphate as indicated. Newly synthesized 47S rRNA was analyzed and quantified as in (B). 47S signals from uridine-treated cells after 75 min pulse were set as one. 28S rRNA EtBr staining under UV-light was used to monitor equal loading, a representative gel is shown. Drug: uridine, 5-FU, or 4sU.
None
Figure 3. Analysis of rRNA synthesis in presence of uridine, 5-fluorouridine (5-FU), and 4-thiouridine (4sU). U2OS cells were incubated with increasing concentrations of drugs as indicated. Nascent RNA was labeled by [32P]-ortho-phosphate, total RNA was purified and analyzed as described in Materials and Methods. Nascent RNA was visualized by autoradiography, total RNA was visualized by ethidium bromide (EtBr) staining under UV-light. Signals were quantified by a PhosphorImager and plotted as relative rRNA levels. Signals from control cells treated with 0.1% DMSO was set as one. A representative experiment is shown.
None
Figure 4. Accumulation of an aberrant 28S rRNA intermediate (IM) upon 4sU treatment. (A) Scheme of the 47S rRNA primary transcript sequence composition and hybridization sites of Northern probes. (B) Analysis of rRNA synthesis by northern blot hybridization. U2OS cells were treated with uridine (100 µM) or 4sU (100 µM) for 6 h and total RNA was purified. Northern blot analysis was performed with probes recognizing 5′ external transcribed spacer (5′ETS, probe 1) or internal transcribed spacer-2 (ITS-2, probe 2) sequences. (C) Quantitation of RNA signals gained by hybridization with probe 1 upon 4sU treatment. Signals corresponding to 47S rRNA and an aberrant intermediate rRNA form (IM) were quantified by PhosphorImager analysis and plotted relative to signals from control cells (0.1% DMSO). Error bars: standard deviation (n = 3).
None
Figure 5. Induction of nucleolar stress upon 4sU treatment. (A) Analysis of nucleophosmin (NPM1) localization in presence of 4sU. U2OS cells were treated with 4sU for 6 h as indicated. NPM1 localization was analyzed by immunofluorescence analysis using a specific antibody. Nuclei were stained with DAPI. Cake diagrams indicate the number of cells with nucleolar (gray) and nuclear (red) NPM1 staining. Scale bar: 1 µm. (B) Analysis of p53 levels upon 4sU treatment. U2OS cells were treated with 4sU as indicated, whole cell lysates were separated by SDS-PAGE and analyzed by Western Blot. P53 levels were quantified by AIDA software and plotted relative to signals from control cells (0.1% DMSO). (C) Analysis of proliferation upon 4sU treatment. U2OS cells were seeded and cultured overnight. Drugs (uridine, 100 µM; 4sU 100 µM; 5-FU 100 µM; ActD 1 µM) were added for 6 h (gray box), medium was replaced and cells were cultured for 100 h. Cell number was measured in real time and compared with control cells (DMEM, ctrl. 1; 0.1% DMSO, ctrl. 2). The cell number correlates to changes in impedance, which is termed “cell index” (see details in Material and Methods). Error bars: Standard deviation (n = 3).

References

    1. Warner JR, Soeiro R. Nascent ribosomes from HeLa cells. Proc Natl Acad Sci USA. 1967;58:1984–90. doi: 10.1073/pnas.58.5.1984. - DOI - PMC - PubMed
    1. Pestov DG, Lapik YR, Lau LF. Assays for ribosomal RNA processing and ribosome assembly. Current protocols in cell biology / editorial board, Juan S Bonifacino [et al] 2008; Chapter 22:Unit 22 11 - PubMed
    1. Cleary MD, Meiering CD, Jan E, Guymon R, Boothroyd JC. Biosynthetic labeling of RNA with uracil phosphoribosyltransferase allows cell-specific microarray analysis of mRNA synthesis and decay. Nat Biotechnol. 2005;23:232–7. doi: 10.1038/nbt1061. - DOI - PubMed
    1. Dölken L, Ruzsics Z, Rädle B, Friedel CC, Zimmer R, Mages J, Hoffmann R, Dickinson P, Forster T, Ghazal P, et al. High-resolution gene expression profiling for simultaneous kinetic parameter analysis of RNA synthesis and decay. RNA. 2008;14:1959–72. doi: 10.1261/rna.1136108. - DOI - PMC - PubMed
    1. Hafner M, Landthaler M, Burger L, Khorshid M, Hausser J, Berninger P, Rothballer A, Ascano M, Jr., Jungkamp AC, Munschauer M, et al. Transcriptome-wide identification of RNA-binding protein and microRNA target sites by PAR-CLIP. Cell. 2010;141:129–41. doi: 10.1016/j.cell.2010.03.009. - DOI - PMC - PubMed

Publication types