

Feeling the force: returning haptic signals influence effort inference during motor coordination
- PMID: 24026052
- PMCID: PMC3770969
- DOI: 10.1038/srep02648
Feeling the force: returning haptic signals influence effort inference during motor coordination
Abstract
Our brain is known to automatically optimize effort expenditure during motor coordination, such that for example, during bimanual braking of a bicycle, a well-oiled brake will automatically be used more than a corroded, heavy brake. But how does our brain infer the effort expenditure? All previous motor coordination models have believed that the effort in a task is known precisely to our brain, solely from the motor commands it generates. Here we show that this belief is incorrect. Through experiments and simulation we exhibit that in addition to the motor commands, the returning haptic signals play a crucial role in the inference of the effort during a force sharing task. Our results thus elucidate a previously unknown sensory-motor association that has major ramifications for our understanding of motor coordination and provides new insights into how sensory modifications due to ergonomics, stroke and disease can affect motor coordination in humans.
Figures
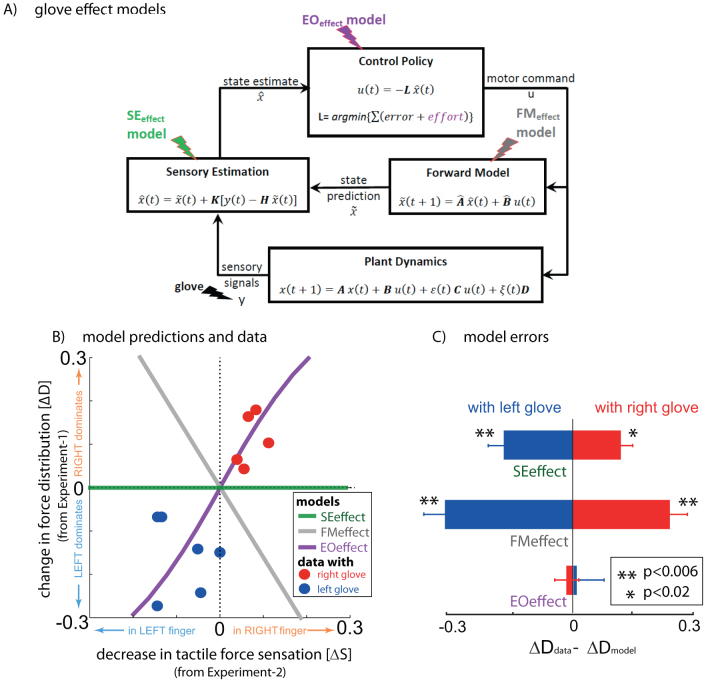
 ). The EOeffect model (violet) assumes the glove affects, not just the sensory signal but also the effort optimization during the task. (B) The models made distinct predictions on how a change in tactile sensation (ΔS) as measure in Experiment-2 would change the force distribution (ΔD) in Experiment-1. (C) The difference between the change in finger force distribution in the data (ΔDdata) and the finger force distribution predicted by the model (ΔDmodel) was significantly different for the SEeffect and FMeffect models during both left (blue bars) and right (red bars) glove sessions. On the other hand, the data conformed well to the EOeffect model for both the left glove (p = 0.79) and right glove (p = 0.47) subjects.
References
-
- Wolpert D. M., Diedrichsen J. & Flanagan J. R. Principles of sensorimotor learning. Nat. Neurosci. Rev. 12, 739–51 (2011). - PubMed
-
- Todorov E. & Jordan M. I. Optimal feedback control as a theory of motor coordination. Nat. Neurosci. 5, 1226–35 (2002). - PubMed
-
- Yang C. et al. Human like adaptation of force and impedance in stable and unstable interactions. IEEE Trans. Robotics. 27, 918–30 (2011).
Publication types
MeSH terms
LinkOut - more resources
Full Text Sources
Other Literature Sources
