. 2013 Dec;110(11):2670-8.
doi: 10.1152/jn.00879.2012. Epub 2013 Sep 11.

Optical imaging of cortical networks via intracortical microstimulation

Affiliations

Optical imaging of cortical networks via intracortical microstimulation

Andrea A Brock et al. J Neurophysiol. 2013 Dec.

Abstract

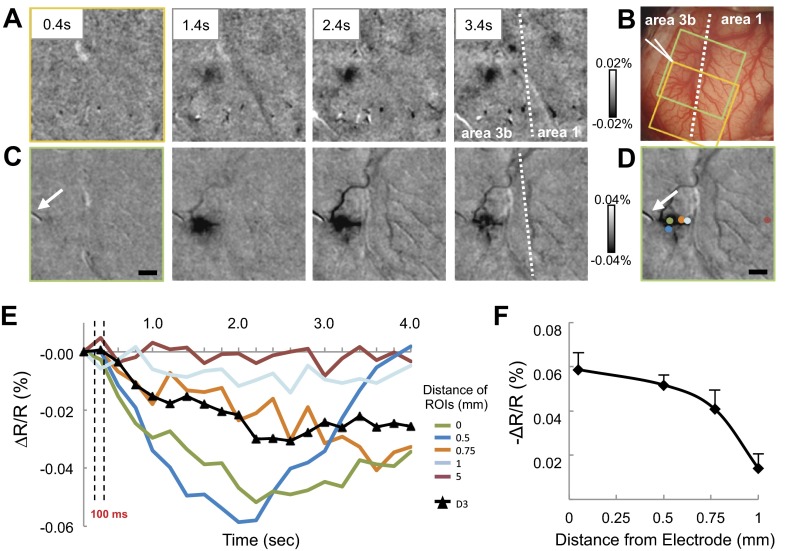
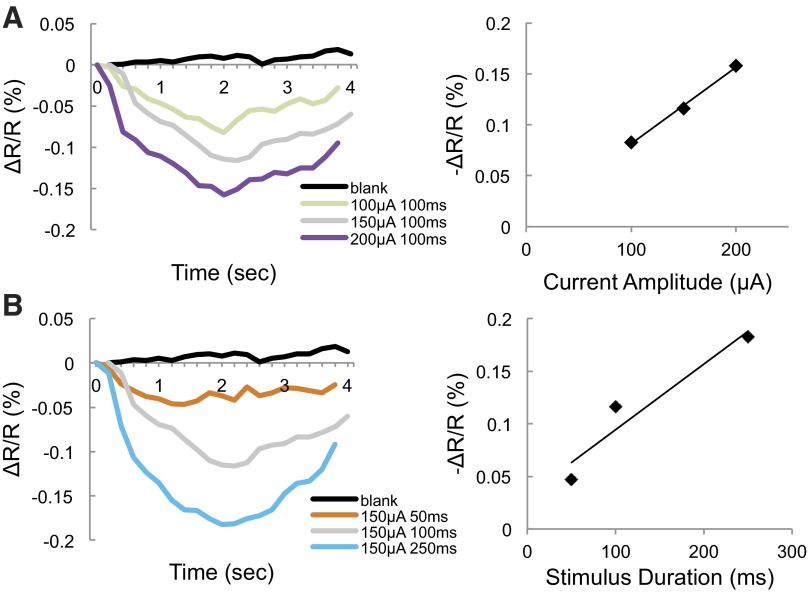
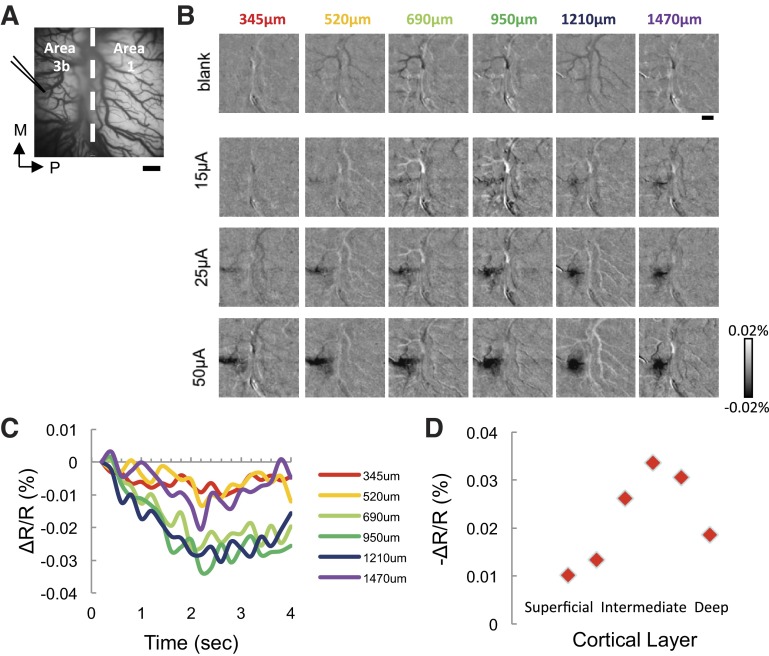
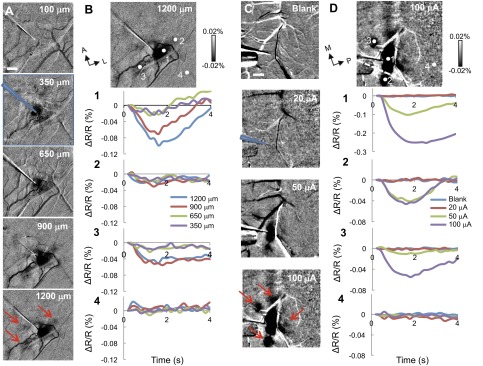
Understanding cortical organization is key to understanding brain function. Distinct neural networks underlie the functional organization of the cerebral cortex; however, little is known about how different nodes in the cortical network interact during perceptual processing and motor behavior. To study cortical network function we examined whether the optical imaging of intrinsic signals (OIS) reveals the functional patterns of activity evoked by electrical cortical microstimulation. We examined the effects of current amplitude, train duration, and depth of cortical stimulation on the hemodynamic response to electrical microstimulation (250-Hz train, 0.4-ms pulse duration) in anesthetized New World monkey somatosensory cortex. Electrical stimulation elicited a restricted cortical response that varied according to stimulation parameters and electrode depth. Higher currents of stimulation recruited more areas of cortex than smaller currents. The largest cortical responses were seen when stimulation was delivered around cortical layer 4. Distinct local patches of activation, highly suggestive of local projections, around the site of stimulation were observed at different depths of stimulation. Thus we find that specific electrical stimulation parameters can elicit activation of single cortical columns and their associated columnar networks, reminiscent of anatomically labeled networks. This novel functional tract tracing method will open new avenues for investigating relationships of local cortical organization.

Keywords: electrical microstimulation; intrinsic signal optical imaging.


Figures

Fig. 1.
Fig. 1.
Electrical microstimulation of cortex evokes a restricted optical imaging of intrinsic signals (OIS) response at the site of stimulation. A and C: 4 imaged frames from squirrel monkey primary somatosensory cortex (SI) showing the temporal response to vibrotactile stimulation of D3 (A) and electrical cortical microstimulation (C) in area 3b. The electrical stimulus consisted of 25-μA, 0.4-ms biphasic pulses, presented at a rate of 250 Hz for 100 ms (26 pulses) at a depth of 800 μm. Evoked OIS are the dark millimeter-sized activations. White dashed line, approximate border between area 3b and area 1. Electrode is indicated by white arrow (C and D). B: imaging fields of view (FOV). Green square, FOV during electrical stimulation run (C); orange square: FOV during tactile stimulation run (A). Electrode penetration site is indicated by white schematic. D: selected regions of interest (ROIs; colored circles) shown on the hemodynamic response at 3.4 s, as shown in C, for which time courses are calculated in E. E: time course of reflectance change (ΔR/R) for select ROIs at various locations from the electrode tip, as shown in D. Line color corresponds to location of colored circle in D. Black trace shows the intrinsic response in area 3b during tactile stimulation. Dashed lines mark the time of stimulation. F: peak amplitude of the hemodynamic signal as a function of distance from the electrode tip. Values derived from the ROIs shown in D. Error bars show SE for the peak response. All images are blank subtracted. Scale bars, 1 mm.
Fig. 2.
Fig. 2.
Cortical activation increases with stimulus intensity and duration. A, left: time course of the response to stimulation with 3 intensities [100, 150, and 200 μA (26 pulses)] and a blank condition in squirrel monkey area 3a. Right: peak response plotted as a function of current amplitude. B, left: time courses of the response for 3 durations (50, 100, and 250 ms) of a 150-μA stimulus. Right: peak response plotted as a function of stimulus duration.
Fig. 3.
Fig. 3.
Activation is dependent on the depth of cortical stimulation. A: vessel map of the FOV of squirrel monkey SI for electrical microstimulation in area 3b. The area 3b/area 1 border is marked by the white dashed line and the electrode by the black schematic. B: hemodynamic response to microelectrode stimulation (26 pulses) for different electrode depths (columns) and current amplitudes (rows). Images are the average of frames acquired 1–3 s after stimulation. Note that the response is more prominent with increasing amplitudes and the response changes shape as the electrode advances. C: time course for the 15-μA stimulus at varying depths. Colored traces correspond to the depths labeled in B (columns). D: peak response plotted as a function of penetration depth for data shown in C. The largest response was seen at 950 μm, which is the closest to layer 4. All images were blank subtracted. Scale bars, 1 mm. M, medial; P, posterior.
Fig. 4.
Fig. 4.
Activation of local projection areas. A: activity maps to microelectrode stimulation (200 μA, 250 ms, 63 pulses) at different electrode depths in squirrel monkey area 3a. Images are the average of frames acquired 1–3 s after stimulation. Red arrows mark locations of activation distant to the site of electrical stimulation. B: activity map generated with the electrode at a depth of 1,200 μm, with circles representing the ROIs used to generate time courses of the hemodynamic response. Numbers labeling the ROIs (white circles) identify the respective graphs. For each ROI, time courses were determined for the different depths of stimulation. C: activation maps in response to microstimulation (600 μm, 250 ms, 63 pulses) with different current amplitudes (0, 20, 50, 100 μA) in the D4 representation in area 1 of galago. Blue, stimulating electrode. D: activity map generated at stimulation intensity of 100 μA. Numbers identify the ROIs from which time courses (shown in graphs) of the hemodynamic response were obtained. White dashed line, approximate border between area 3b and area 1. For each ROI, colored lines indicate different amplitudes of stimulation. Scale bar, 1 mm. A, anterior; L, lateral.

Similar articles

Cited by

References

    1. Bonhoeffer T, Grinvald A. Optical imaging based on intrinsic signals: the methodology. In: Brain Mapping: The Methods, edited by Toga AW, Mazziotta JC. San Diego, CA: Academic, 1996, p. 55–97
    1. Brodmann K. Vergleichende Lokalisationslehre der Grosshirnrinde in ihren Prinzipien dargestellt auf Grund des Zellenbaues. Leipzig, Germany: Barth, 1909. (English translation by Laurence Garey as Brodmann's “Localisation in the Cerebral Cortex.” London: Smith-Cordon, 1994)
    1. Bruce CJ, Goldberg ME, Bushnell MC, Stanton GB. Primate frontal eyefields. II. Physiological and anatomical correlates of electrically evoked eye movements. J Neurophysiol 54: 714–734, 1985 - PubMed
    1. Bullmore E, Sporns O. Complex brain networks: graph theoretical analysis of structural and functional systems. Nat Rev Neurosci 10: 186–198, 2009 - PubMed
    1. Callaway EM. Local circuits in primary visual cortex of the macaque monkey. Annu Rev Neurosci 21: 47–74, 1998 - PubMed

Publication types

LinkOut - more resources