. 2013 Sep 11;33(37):14825-39.
doi: 10.1523/JNEUROSCI.1611-13.2013.

The pattern of cortical dysfunction in a mouse model of a schizophrenia-related microdeletion

Affiliations

The pattern of cortical dysfunction in a mouse model of a schizophrenia-related microdeletion

Karine Fénelon et al. J Neurosci. .

Abstract

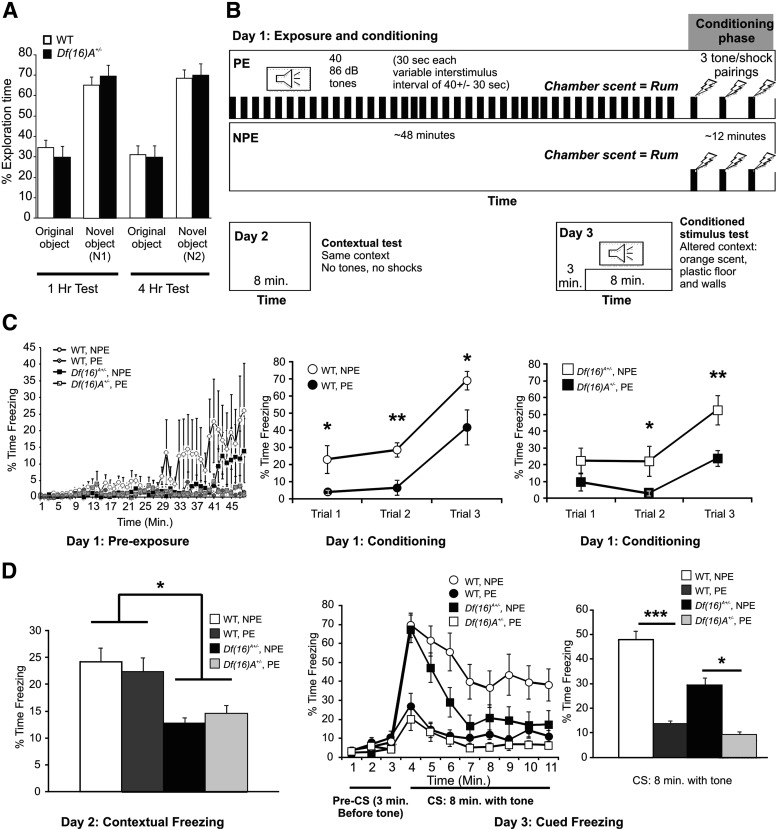
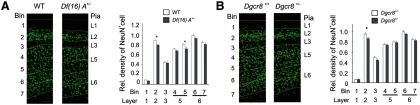
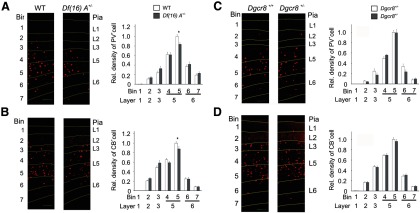
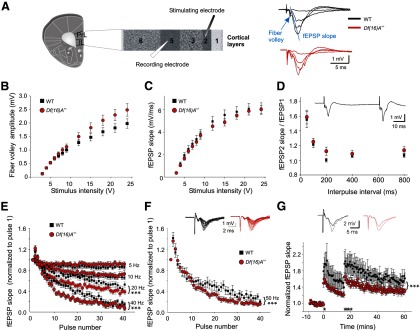
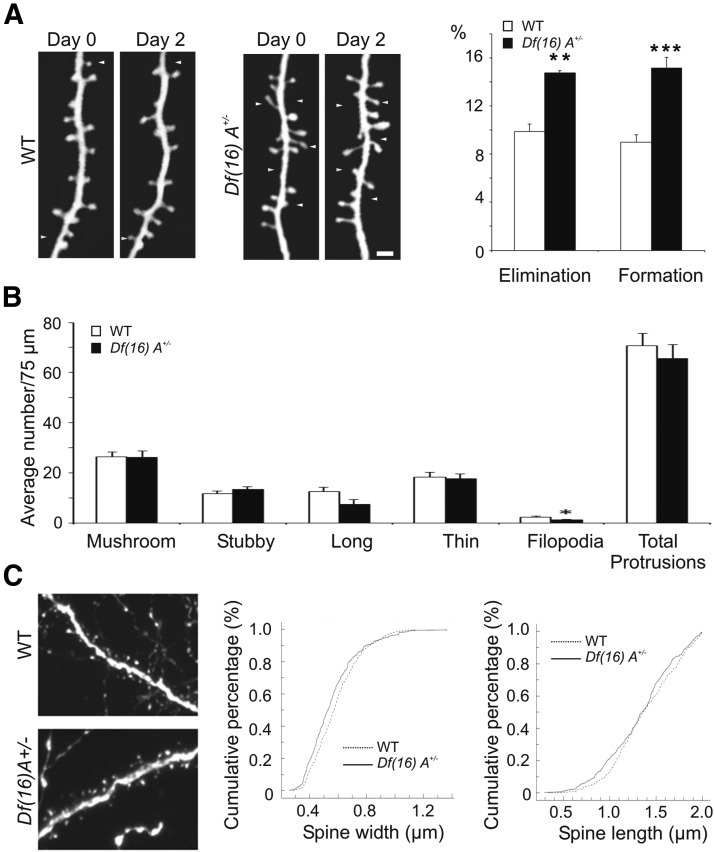
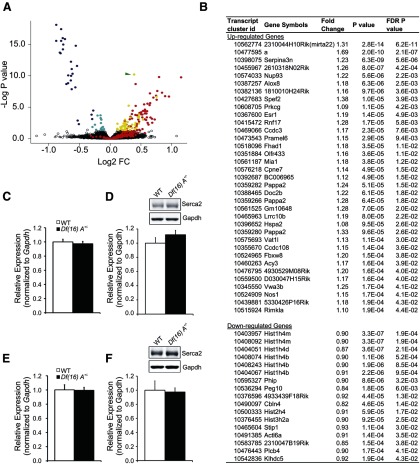
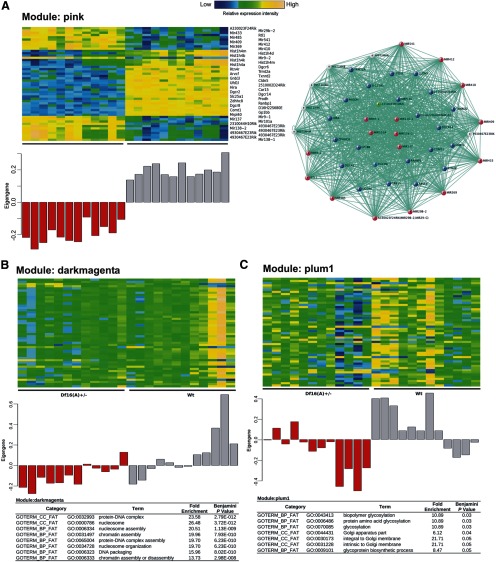
We used a mouse model of the schizophrenia-predisposing 22q11.2 microdeletion to evaluate how this genetic lesion affects cortical neural circuits at the synaptic, cellular, and molecular levels. Guided by cognitive deficits, we demonstrated that mutant mice display robust deficits in high-frequency synaptic transmission and short-term plasticity (synaptic depression and potentiation), as well as alterations in long-term plasticity and dendritic spine stability. Apart from previously reported reduction in dendritic complexity of layer 5 pyramidal neurons, altered synaptic plasticity occurs in the context of relatively circumscribed and often subtle cytoarchitectural changes in neuronal density and inhibitory neuron numbers. We confirmed the pronounced DiGeorge critical region 8 (Dgcr8)-dependent deficits in primary micro-RNA processing and identified additional changes in gene expression and RNA splicing that may underlie the effects of this mutation. Reduction in Dgcr8 levels appears to be a major driver of altered short-term synaptic plasticity in prefrontal cortex and working memory but not of long-term plasticity and cytoarchitecture. Our findings inform the cortical synaptic and neuronal mechanisms of working memory impairment in the context of psychiatric disorders. They also provide insight into the link between micro-RNA dysregulation and genetic liability to schizophrenia and cognitive dysfunction.


Figures

Figure 1.
Figure 1.
NOR and LI assays of Df(16)A+/− mice. A, In the NOR test, Df(16)A+/− mice and their WT littermates spent a similar amount of time exploring novel objects relative to familiar objects to which they had been exposed to 1 or 4 h before testing [n = 14 WT, 14 Df(16)A+/−; all p > 0.05]. B, LI test design scheme. C, Left, During the preexposure phase, NPE mice tended to move less over time. Middle and right, During the conditioning phase of the LI test, LI was demonstrated across three trials of CS–US pairing for both Df(16)A+/− and WT mice. The Df(16)A+/− mice exhibited a delay in learning on day 1. D, Left, On day 2, Df(16)A+/− mice demonstrated a deficit in contextual fear conditioning. Middle, Time course of the freezing response during the pre-CS and CS test. Both Df(16)A+/− and WT mice demonstrated LI (decreased freezing in PE mice vs NPE mice). Right, Bar graph of the 8 min CS (cued) part of the test demonstrating LI in both genotypes on day 3, as well as decreased overall freezing in the Df(16)A+/−mice. *p ≤ 0.05, **p < 0.01, ***p < 0.001. Data are shown as means ± SEM.
Figure 2.
Figure 2.
Cytoarchitectural changes in the cortex of Df(16)A+/− mice. A, Left, Schematic representation of probe locations for quantifying density of neurons labeled with a pan-neuronal marker (NeuN, green) in the prelimbic area of mPFC of 8-week-old WT and Df(16)A+/− mice. Right, NeuN-labeled cells in mPFC of WT and Df(16)A+/− mice. The relative density of NeuN-labeled cells across seven bins from pia to white matter at the mPFC is shown. B, Left, Schematic representation of probe locations for quantifying density of neurons labeled with a pan-neuronal marker (NeuN, green) in the prelimbic area of mPFC of 8-week-old WT and Dgcr8+/− mice. Right, NeuN-labeled cells in mPFC of WT and Dgcr8+/− mice. The relative density of NeuN-labeled cells across seven bins from pia to white matter at the mPFC is shown. Data are shown as mean ± SEM. *p < 0.05. Scale bars, 100 μm.
Figure 3.
Figure 3.
The effect of Df(16)A on the density of cortical inhibitory interneurons. A, Left, Schematic representation of probe locations for quantifying density of inhibitory neurons labeled with a PV antibody (red) in the prelimbic area of mPFC of 8-week-old WT and Df(16)A+/− mice. Right, PV-labeled cells in mPFC of WT and Df(16)A+/− mice. The relative density of PV-labeled cells across seven bins from pia to white matter at the mPFC is shown. B, Left, Schematic representation of probe locations for quantifying density of inhibitory neurons labeled with a PV antibody (red) in the prelimbic area of mPFC of 8-week-old WT and Dgcr8+/− mice. Right, PV-labeled cells in mPFC of WT and Dgcr8+/− mice. The relative density of PV-labeled cells across seven bins from pia to white matter at the mPFC is shown. C, Left, Schematic representation of probe locations for quantifying density of inhibitory neurons labeled with a CB antibody (red) in the mPFC of 8-week-old WT and Df(16)A+/− mice. Right, CB-labeled cells in mPFC of WT and Df(16)A+/− mice. The relative density of CB-labeled cells across seven bins from pia to white matter at the mPFC is shown. D, Left, Schematic representation of probe locations for quantifying density of inhibitory neurons labeled with a CB antibody (red) in the mPFC of 8-week-old WT and Dgcr8+/− mice. Right, CB-labeled cells in mPFC of WT and Dgcr8+/− mice. The relative density of CB-labeled cells across seven bins from pia to white matter at the mPFC is shown. Data are shown as mean ± SEM. *p < 0.05. Scale bars, 100 μm.
Figure 4.
Figure 4.
The effect of Df(16)A on synaptic transmission and synaptic plasticity in cortical L5. A, Left, Schematic representation of a coronal mPFC slice including the prelimbic (PrL) and infralimbic (IL) areas. The stimulating electrode was placed on L2, and the recording electrode was placed in L5. Right, Sample traces obtained in response to increasing stimulation intensities and showing the fiber volley (arrow) as well as the fEPSP initial slope (blue line). B, Plot showing normal afferent volley amplitude in Df(16)A+/− mice (2-way repeated-measures ANOVA, p > 0.05). C, Plot showing normal stimulus–response curve across experiments in Df(16)A+/− mice (2-way repeated-measures ANOVA, p > 0.05). In both C and D, WT mice (black squares; N = 17, n = 40) and Df(16)A+/− mice (red circles; N = 16, n = 38). D, Plot showing that paired-pulse ratio is normal in Df(16)A+/− mice at ISIs of 50, 100, 200, 400, and 800 ms (2-way repeated-measures ANOVA, p > 0.05). Individual points represent mean ratio obtained at each ISI for both genotypes. WT mice (black squares; N = 7, n = 16) and Df(16)A+/− mice (red circles; N = 7, n = 16). A paired-pulse sample trace is shown at the top with an ISI of 50 ms. E, Plot showing the frequency dependence of STD of the fEPSPs between WT (black squares; N = 7, n = 16) and Df(16)A+/− (red circles; N = 6, n = 13) mice at 5 Hz (1st pair of black and red symbols), 10 Hz (2nd pair of black and red symbols), 20 Hz (3rd pair of black and red symbols), and 40 Hz (4th pair of black and red symbols). At 5 and 10 Hz, STD is similar between genotypes across experiments (2-way repeated-measures ANOVA, p > 0.05). At 20 and 40 Hz, both genotypes show a similar facilitation between the first two pulses, but the subsequent STD is significantly greater in Df(16)A+/− mice (N = 9, n = 18) compared with their WT controls (N = 9, n = 18; 2-way repeated-measures ANOVA, p < 0.0001 for 20 Hz × genotype interaction; p < 0.0004 for 40 Hz × genotype interaction). F, Plot showing that, at 50 Hz, the initial short-term facilitation is similar between genotypes but the following STD is significantly greater in Df(16)A+/− mice (red circles; N = 9, n = 20) compared with their WT littermates (black squares; N = 10, n = 20; 2-way repeated-measures ANOVA; p = 0.0003 for the 50 Hz × genotype interaction). Superimposed sample traces of individual fEPSPs evoked by 40 stimuli at 50 Hz in WT (black traces) and Df(16)A+/− (red traces) mice are shown. G, The plot shows synaptic potentiation in WT mice (black squares; N = 7, n = 12) and Df(16)A+/− mice (red circles; N = 7, n = 16). There is a significant difference in the degree of STP and LTP of fEPSPs over time (2-way repeated-measures ANOVA, p = 0.0215 for genotype and p < 0.0001 for time × genotype interaction). At the end of the first 50 Hz train (1st asterisk), the level of STP is significantly lower in the Df(16)A+/− mice [at 14.5 min: WT, 1.57 ± 0.14 vs Df(16)A+/−, 1.23 ± 0.06; post hoc test, p < 0.05]. Similarly, after the four consecutive 50 Hz trains (4 asterisks), post hoc testing revealed that the difference in potentiation lasts for the entire duration of the remaining testing period, affecting both STP and LTP [at 60 min: WT, 1.61 ± 0.12 vs Df(16)A+/−: 1.30 ± 0.05; post hoc test, p < 0.05]. fEPSPs traces obtained before [WT and Df(16)A+/− mice are black and red traces, respectively] and immediately after the first 50 Hz train [WT and Df(16)A+/− are gray and pink traces, respectively] are shown at the top. Values are normalized to slope of the first fEPSP in the train (D–F) or to the baseline (G).
Figure 5.
Figure 5.
Altered spine turnover in the cortex of Df(16)A+/− mice. A, In juvenile mice (P30 ± 1), using in vivo two-photon microscopy, Df(16)A+/−;Thy1–YFP/H+/− mice were shown to have significantly greater spine elimination, as well as significantly greater spine formation, relative to WT;Thy1–YFP/H+/− mice (t test, p = 0.003 and p = 0.0009, respectively). B, Except for a small decrease in filopodia in the Df(16)A+/−;Thy1–GFP/M+/− mice, no significant differences were found in the density of apical spine types between the genotypes. C, The width of apical mushroom spines was decreased (by 4.9%) in the Df(16)A+/−;Thy1–GFP/M+/− mice. No significant differences were found in apical mushroom spine length between genotypes. Data are shown as means ± SEM. *p ≤ 0.05, **p < 0.01, ***p < 0.001.
Figure 6.
Figure 6.
Molecular abnormalities in the cortex of Df(16)A+/− mice. A, Volcano plot of the FDR-corrected log p values (y-axis) and the corresponding log2-fold change of each gene (x-axis) of the PFC gene expression profile of Df16(A)+/− mice. Blue spots represent genes within the Df16(A) deficiency. Red spots represent primary transcripts of miRNA genes. Cyan spots represent downregulated protein encoding genes. Yellow spots represent upregulated protein encoding genes. Green arrow indicates 2310044H10Rik/Mirta22 (18) (B). List of genes differentially expressed in the PFC region of Df(16)A+/− mice. C–F, Atp2a2 mRNA and protein levels in PFC and HPC of adult Df(16)A+/− mice. Atp2a2 mRNA expression levels in PFC (C) and HPC (E) of adult Df(16)A+/− mice (n = 10 for PFC, n = 7 for HPC) and their WT littermates (n = 10 for PFC, n = 5 for HPC), as assayed by qRT-PCR. p = 0.59 (PFC), p = 0.73 (HPC), Student's t test. D, F, Atp2a2 protein expression levels in synaptosomal preparations from PFC (C) and HPC (E) of adult Df(16)A+/− mice and their WT littermate mice. Top, Representative Western blot assays of Atp2a2 in PFC (C) and HPC (E) synaptosomal samples prepared from Df(16)A+/− animals and WT littermates. GAPDH is used as loading control. Bottom, Quantification of Atp2a2 protein levels in PFC (D) and HPC (F) of Df(16)A+/− and WT animals (n = 5 each genotype). p = 0.27 (PFC), p = 0.87 (HPC), Student's t test. Expression levels in mutant animals were normalized to their respective WT littermates. Results are expressed as mean ± SEM.
Figure 7.
Figure 7.
Disrupted biological processes in the cortex of Df(16)A+/− mice. A, Left, Gene expression heat map of the top 50 genes included in the top module (pink) identified by WGCNA analysis (top) and the module eigengene values (y-axis) for each sample (x-axis). Right, Correlation expression network of the top module. Blue spots indicate genes within the Df16(A) deficiency. Red spots indicate primary transcripts of miRNA genes. Cyan spots represent downregulated protein encoding genes. Yellow spots depict upregulated protein encoding genes. The green spot indicates 2310044H10Rik/Mirta22 (Xu et al., 2013). B, C, Indicated are gene expression heat maps of the top 50 genes included in two modules that are highly correlated with genotype and show statistically significant GO term enrichment (top) and the module eigengene values (y-axis) for each sample (x-axis).

References

    1. Arguello PA, Gogos JA. Modeling madness in mice: one piece at a time. Neuron. 2006;52:179–196. doi: 10.1016/j.neuron.2006.09.023. - DOI - PubMed
    1. Arguello PA, Gogos JA. Cognition in mouse models of schizophrenia susceptibility genes. Schizophr Bull. 2010;36:289–300. doi: 10.1093/schbul/sbp153. - DOI - PMC - PubMed
    1. Arguello PA, Gogos JA. Genetic and cognitive windows into circuit mechanisms of psychiatric disease. Trends Neurosci. 2012;35:3–13. doi: 10.1016/j.tins.2011.11.007. - DOI - PubMed
    1. Bannister AP. Inter- and intra-laminar connections of pyramidal cells in the neocortex. Neurosci Res. 2005;53:95–103. doi: 10.1016/j.neures.2005.06.019. - DOI - PubMed
    1. Barañano DE, Ferris CD, Snyder SH. Atypical neural messengers. Trends Neurosci. 2001;24:99–106. doi: 10.1016/S0166-2236(00)01716-1. - DOI - PubMed

Publication types

MeSH terms