. 2013 Sep 11;33(37):14949-57.
doi: 10.1523/JNEUROSCI.2793-13.2013.

Effects of cathodal trans-spinal direct current stimulation on mouse spinal network and complex multijoint movements

Affiliations

Effects of cathodal trans-spinal direct current stimulation on mouse spinal network and complex multijoint movements

Zaghloul Ahmed. J Neurosci. .

Abstract

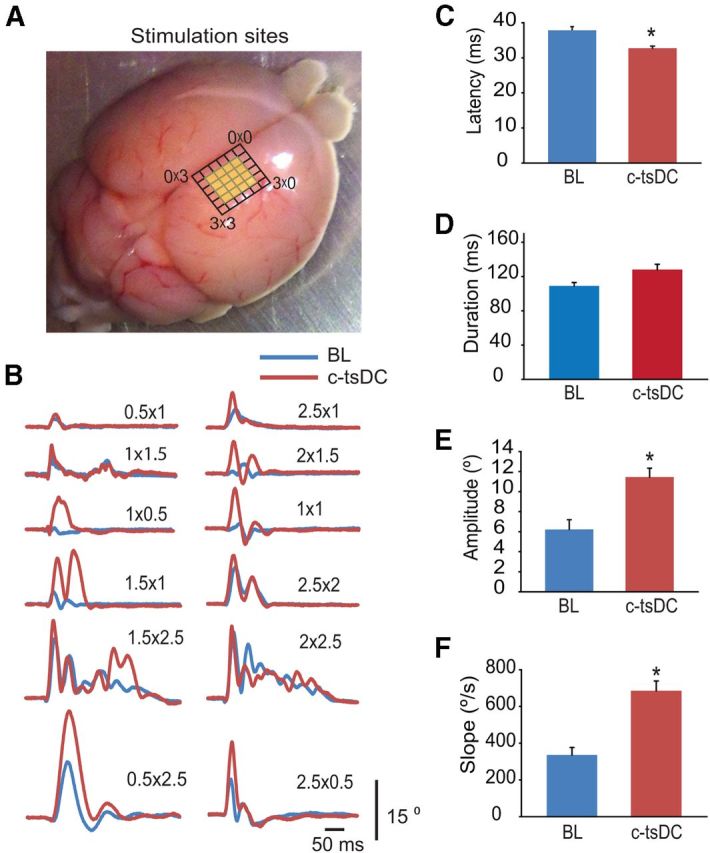
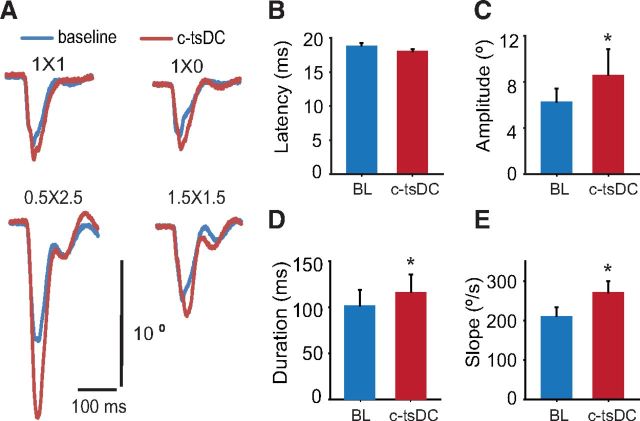
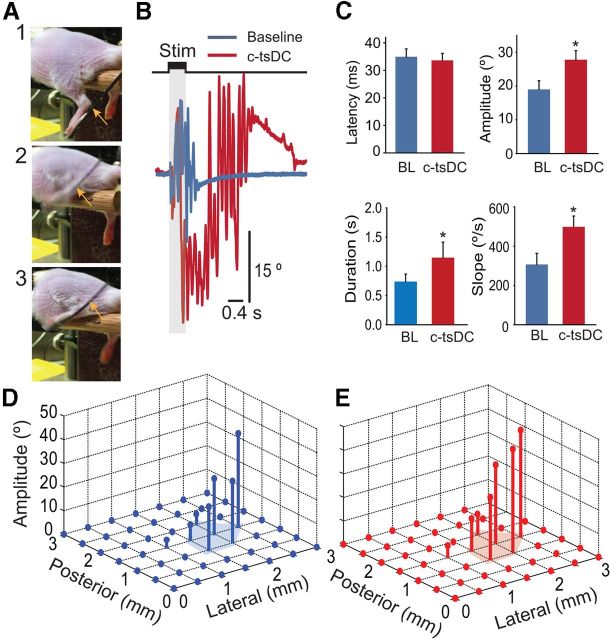
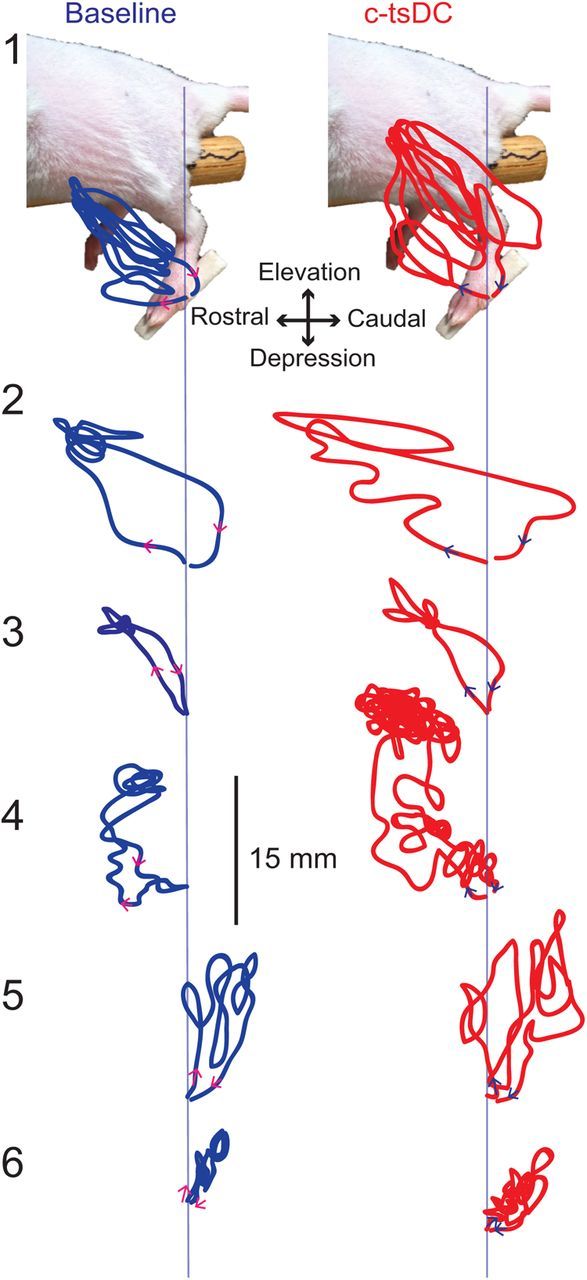
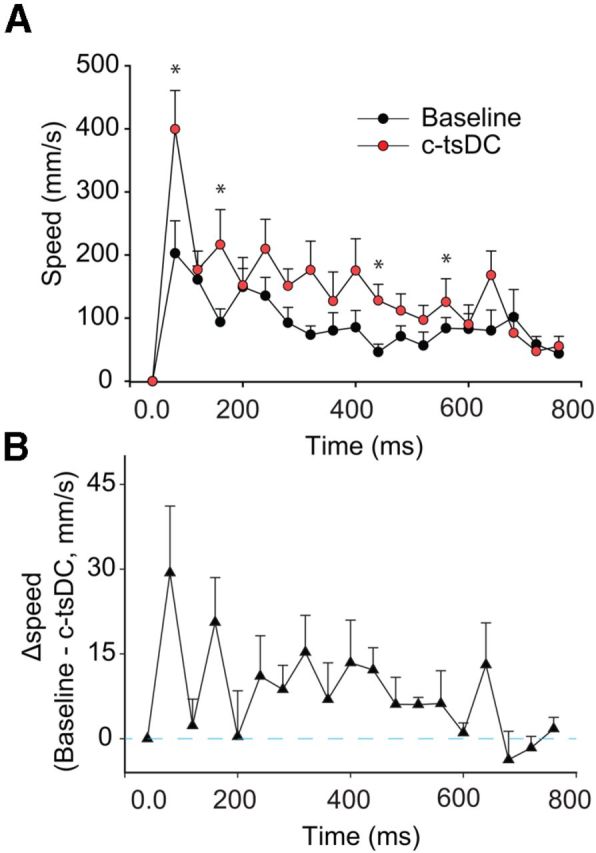
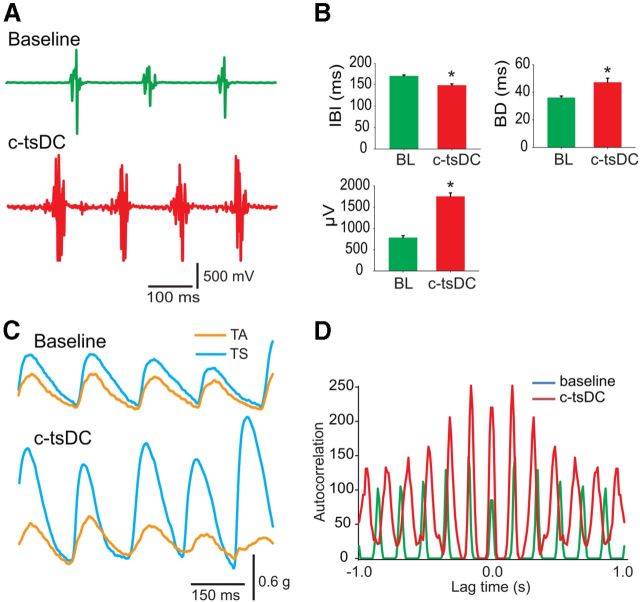
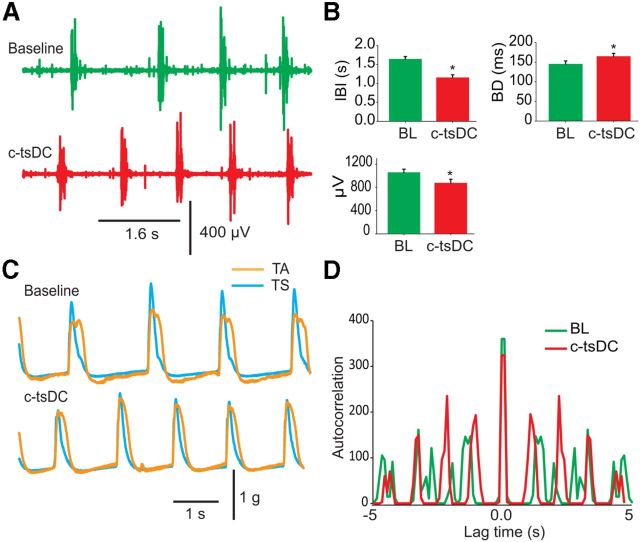
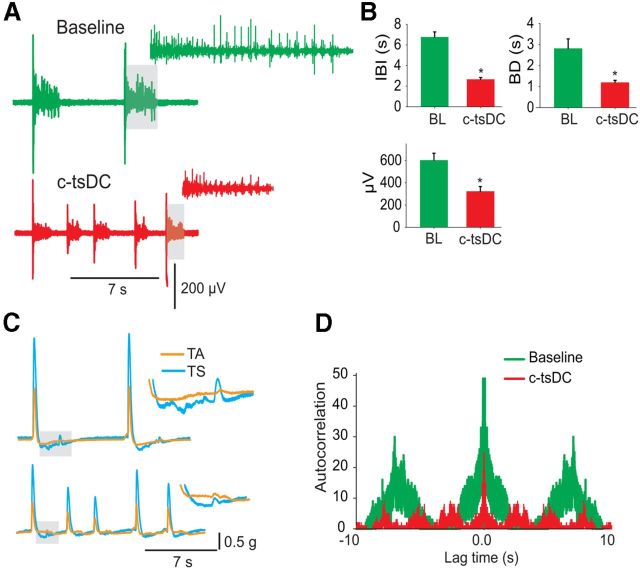
Cathodal trans-spinal direct current (c-tsDC) stimulation is a powerful technique to modulate spinal excitability. However, the manner in which c-tsDC stimulation modulates cortically evoked simple single-joint and complex multijoint movements is unknown. To address this issue, anesthetized mice were suspended with the hindlimb allowed to move freely in space. Simple and complex multijoint movements were elicited with short and prolonged trains of electrical stimulation, respectively, delivered to the area of primary motor cortex representing the hindlimb. In addition, spinal cord burst generators are known to be involved in a variety of motor activities, including locomotion, postural control, and voluntary movements. Therefore, to shed light into the mechanisms underlying movements modulated by c-tsDC stimulation, spinal circuit activity was induced using GABA and glycine receptor blockers, which produced three rates of spinal bursting activity: fast, intermediate, and slow. Characteristics of bursting activity were assessed during c-tsDC stimulation. During c-tsDC stimulation, significant increases were observed in (1) ankle dorsiflexion amplitude and speed; (2) ankle plantarflexion amplitude, speed, and duration; and (3) complex multijoint movement amplitude, speed, and duration. However, complex multijoint movement tracing showed that c-tsDC did not change the form of movements. In addition, spinal bursting activity was significantly modulated during c-tsDC stimulation: (1) fast bursting activity showed increased rate, amplitude, and duration; (2) intermediate bursting activity showed increased rate and duration, but decreased amplitude; and (3) slow bursting activity showed increased rate, but decreased duration and amplitude. These results suggest that c-tsDC stimulation amplifies cortically evoked movements through spinal mechanisms.


Figures

Figure 1.
Figure 1.
c-tsDC increased the amplitude of dorsiflexion movements. Movement traces were derived from an angle sensor. A, Brain photograph showing sites of motor cortex where movements were elicited (yellow). B, Dorsiflexion was elicited from 12 sites (lateral × posterior location relative to bregma labeled over traces). Note that c-tsDC stimulation increased dorsiflexion amplitude in all sites (red) compared with baseline (blue). Cortical stimulation intensity was 400 μA for sites 1.5 × 2.5 and 2 × 2.5 and 500 μA for all other sites. C, Latency of dorsiflexion was significantly reduced during c-tsDC stimulation. D, Movement duration was not changed during c-tsDC stimulation. E, Dorsiflexion amplitude was significantly increased during c-tsDC stimulation. F, Rising slope of the first deflection of the dorsiflexion movement was significantly increased during c-tsDC stimulation. *p < 0.01. Data are means ± SEM.
Figure 2.
Figure 2.
c-tsDC stimulation increased the amplitude of plantarflexion movements. Movement traces were derived from an angle sensor. Cortical stimulation was at 500 μA at all sites. A, Plantarflexion was elicited from four sites (lateral × posterior location relative to bregma labeled over traces). B, No significant change in movement latency was observed during c-tsDC stimulation. C, Amplitude was significantly increased during c-tsDC stimulation. D, Duration was significantly increased during c-tsDC stimulation. E, Movement slope was significantly increased during c-tsDC stimulation. *p < 0.01. Data are means ± SEM.
Figure 3.
Figure 3.
Effects of c-tsDC stimulation on complex multijoint movements of the hindlimb. Each animal was anesthetized, its head was restrained, and its body was supported with a system constructed at our laboratory that left the hindlimb free to move in all directions. Movement traces were derived from an angle sensor. A, Three consecutive video frames: (1) before cortical stimulation, (2) just before holding position, and (3) at holding position. Arrows mark the angle sensor. B, Examples of movement traces recorded with the angle sensor. The cortical stimulation time is shown at the top of the graph. Note that stimulation time (600 ms) is much shorter than the movement time, especially during c-tsDC stimulation (red). C, Latency was unchanged, but amplitude, duration, and slope were increased by c-tsDC stimulation. *p < 0.05 (n = 10). D, E, Complex multijoint movement map based on amplitude measured by the angle sensor shows the average amplitude of the movements at baseline (D) and during c-tsDC stimulation (E; n = 10). Bregma is denoted by the 0.0 point, and the shaded region indicates the cortical area where stimulation evoked the greatest complex multijoint movement. Data are means ± SEM.
Figure 4.
Figure 4.
c-tsDC stimulation changed the amplitude of the movements but not their form. Movement traces were derived from video tracking (30 frames/s). Complex multijoint movements were elicited in four animals by stimulating the contralateral motor cortex; Traces 1–3 are from different animals, and Traces 4–6 are from the same animal. Trace 4 shows left hindlimb movement elicited by stimulating the right cortex, and Traces 5 and 6 show right hindlimb movement elicited by stimulating the left cortex at two different sites. Movements were videotaped, and the fifth digit was marked and traced using motion analysis software. Trace 1 is overlaid on a photograph of the animal. The vertical lines show the start and end of each movement.
Figure 5.
Figure 5.
c-tsDC stimulation increased the speed of complex multijoint movements. Speed profiles are shown for the first 800 ms of the movements shown in Figure 4. A, Speed was significantly increased at four points during c-tsDC stimulation. *p < 0.05, Holm–Sidak post hoc test. B, Change in speed from baseline to c-tsDC stimulation. Data are means ± SEM.
Figure 6.
Figure 6.
c-tsDC modulates fast bursting activity (IBI, <200 ms). A, Examples of bursting activity recorded at baseline (green) and during c-tsDC (red). B, Summary plots showing that c-tsDC significantly increased burst rate (reduced IBI), duration, and amplitude. C, Muscle twitches from antagonistic TA and TS muscles recorded simultaneously show that the induced activity is synchronous and motor in nature. D, Average autocorrelations calculated for baseline (green) and during c-tsDC (red). *p < 0.05. Data are means ± SEM.
Figure 7.
Figure 7.
c-tsDC stimulation modulates intermediate bursting activity (IBI, >1 s but <2 s). A, Examples of bursts recorded at baseline (green) and during c-tsDC stimulation (red). Note that there were four bursts during c-tsDC stimulation compared with three during baseline over the same recording period. B, Summary plots showing that c-tsDC stimulation significantly increased burst rate (reduced IBI) and duration, but reduced amplitude. C, Muscle twitch recorded simultaneously from TA and TS muscles. D, Average autocorrelations calculated for baseline (green) and during c-tsDC stimulation (red) showed that burst activity became more rhythmic during c-tsDC stimulation. *p < 0.05. Data are means ± SEM.
Figure 8.
Figure 8.
c-tsDC stimulation modulates slow bursting activity (IBI, >5 s). A, Examples of slow burst activity at baseline (green) and during c-tsDC stimulation (red). These bursts contain sub-bursts, as shown in the expanded illustration. Expanded illustration corresponds to the shaded area. B, Summary plots showing that c-tsDC stimulation significantly increased burst rate (reduced IBI), but reduced duration and amplitude. C, Examples of muscle twitches recorded simultaneously from TA and TS muscles. The expanded area shows muscle twitches corresponding to the sub-bursts. D, Average autocorrelations calculated for baseline (green) and during c-tsDC stimulation (red) showed clear changes in bursting activity during c-tsDC stimulation. *p < 0.05. Data are means ± SEM.

References

    1. Aguilar J, Pulecchi F, Dilena R, Oliviero A, Priori A, Foffani G. Spinal direct current stimulation (sDCS) modulates the activity of gracile nucleus and primary somatosensory cortex in anesthetized rats. J Physiol. 2011;589:4981–4996. doi: 10.1113/jphysiol.2011.214189. - DOI - PMC - PubMed
    1. Ahmed Z. Trans-spinal direct current stimulation modulates motor cortex-induced muscle contraction in mice. J Appl Physiol. 2011;110:1414–1424. doi: 10.1152/japplphysiol.01390.2010. - DOI - PubMed
    1. Ahmed Z. Electrophysiological characterization of spino-sciatic and cortico-sciatic associative plasticity: modulation by trans-spinal direct current and effects on recovery after spinal cord injury in mice. J Neurosci. 2013;33:4935–4946. doi: 10.1523/JNEUROSCI.4930-12.2013. - DOI - PMC - PubMed
    1. Ahmed Z, Wieraszko A. Trans-spinal direct current enhances corticospinal output and stimulation-evoked release of 2 glutamate analog, D-2,33H-aspartic acid. J Appl Physiol. 2012;112:1576–1592. doi: 10.1152/japplphysiol.00967.2011. - DOI - PubMed
    1. Alanis J. Effects of direct current on motor neurones. J Physiol. 1953;120:569–578. - PMC - PubMed

Publication types

MeSH terms

LinkOut - more resources