. 2013 Sep;15(9):1086-99.
doi: 10.1593/neo.13998.

MicroRNA-130b promotes tumor development and is associated with poor prognosis in colorectal cancer

Affiliations

MicroRNA-130b promotes tumor development and is associated with poor prognosis in colorectal cancer

Tommaso Colangelo et al. Neoplasia. 2013 Sep.

Abstract

MicroRNA-130b (miR-130b) is involved in several biologic processes; its role in colorectal tumorigenesis has not been addressed so far. Herein, we demonstrate that miR-130b up-regulation exhibits clinical relevance as it is linked to advanced colorectal cancers (CRCs), poor patients' prognosis, and molecular features of enhanced epithelial-mesenchymal transition (EMT) and angiogenesis. miR-130b high-expressing cells develop large, dedifferentiated, and vascularized tumors in mouse xenografts, features that are reverted by intratumor injection of a specific antisense RNA. In contrast, injection of the corresponding mimic in mouse xenografts from miR-130b low-expressing cells increases tumor growth and angiogenic potential while reduces the epithelial hallmarks. These biologic effects are reproduced in human CRC cell lines. We identify peroxisome proliferator-activated receptor γ (PPARγ) as an miR-130b direct target in CRC in vitro and in vivo. Notably, the effects of PPARγ gain- and loss-of-function phenocopy those due to miR-130b down-regulation or up-regulation, respectively, underscoring their biologic relevance. Furthermore, we provide mechanistic evidences that most of the miR-130b-dependent effects are due to PPARγ suppression that in turn deregulates PTEN, E-cadherin, Snail, and vascular endothelial growth factor, key mediators of cell proliferation, EMT, and angiogenesis. Since higher levels of miR-130b are found in advanced tumor stages (III-IV), we propose a novel role of the miR-130b-PPARγ axis in fostering the progression toward more invasive CRCs. Detection of onco-miR-130b and its association with PPARγ may be useful as a prognostic biomarker. Its targeting in vivo should be evaluated as a novel effective therapeutic tool against CRC.


Figures
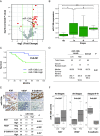
Figure 1
Figure 1
miR-130b up-regulation in CRC samples associates with indexes of tumor aggressiveness and shorter patients' survival. (A) Bio-informatic analysis conducted on data from GEO record GSE35602. Volcano plot shows differentially expressed miRNAs (red squares; fold change > 2, P ≤ .05); miR-130b (green square) is arrowed. Green lines indicate the fold change and P value thresholds. (B) The box plot depicts miR-130b levels assessed by qRT-PCR in the normal mucosa (NM) and in our series of 80 CRC samples classified according tumor stage (stage I, n = 4; stage II, n = 44; stage III, n = 24; stage IV, n = 8). *P ≤ .05; **P ≤ .01. (C) Kaplan-Meier survival analysis according to miR-130b levels. The overall survival of miR-130b high-expressing group (n = 47) was significantly lower than that of the low-expressing group (n = 33; log-rank test; P < .001). (D) Cancer-related death events and median survival time of the same patients are tabulated (two-sided Fisher exact test; P = .02). (E) Representative Ki-67, E-cadherin, and VEGF immunostaining of miR-130b low- or high-expressing tumors; the relationship between miR-130b and the analyzed markers is summarized in the lower table (P values were calculated by two-sided Fisher exact test). (F) Box plots report miR-130b expression average in tumor tissues stratified according to Ki-67 (all stages; n = 80), VEGF (all stages; n = 80), and E-cadherin (stages III and IV; n = 32) staining; P values were calculated by paired t test.
Figure 2
Figure 2
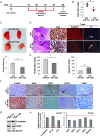
miR-130b acts as oncogenic miRNA in the mouse xenograft model. (A) Timeline of miRNA delivery experiments. At day 13, miR-130b inhibitor (anti-miR-130b; n = 5) or scrambled control (anti-miR-Ctrl; n = 5) was intratumorally injected every 7 days for four cycles. (B) qRT-PCR validation of miR-130b knockdown in HCT116-derived tumors treated with anti-miR-130b. (C) Representative photographs of tumors excised from each experimental group (upper panel). The graph in the lower panel reports tumor weight (g) at the end of the treatment. (D) Representative photomicrographs of hematoxylin and eosin, Ki-67, and TUNEL assay performed on paraffin-embedded tissues from the two experimental conditions; arrows point to remarkable features of the images. Scale bars, 200 µm. (E) Proliferative and apoptotic indexes evaluated according to total number of Ki-67 or fluorescein-2′-deoxyuridine, 5′-triphosphate (dUTP)-positive cells in at least 10 low-power fields. (F) Immunohistochemical analysis of E-cadherin, Snail, CD31, type IV collagen, and VEGF performed on tumor tissues injected with anti-miR-Ctrl or anti-miR-130b. Scale bars, 200 µm. (G) Western blot analysis of E-cadherin, VEGF, and β-actin in tumors treated as in A. Protein fold changes with respect to controls are reported below the corresponding band (Student's t test; *P ≤ .05). (H) qRT-PCR assessment of the indicated markers; the mean values detected in controls were used as calibrators and highlighted with dotted red lines (P values reported were determined by Student's t test). Data are represented as means ± SD from at least two independently treated tumors. *P ≤ .05; **P ≤ .01.
Figure 3
Figure 3
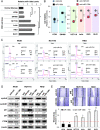
miR-130b promotes cell proliferation and motility. (A) The bar plot reports qRT-PCR analysis of miR-130b in the indicated cell lines with respect to the expression average detected in normal tissues (normal mucosa; n = 80). (B) Graphical representation of the MTT assay performed 48 hours after transfection of the indicated cell lines with the miR-130b mimic (miR-130b), miR-130b inhibitor (anti-miR-130b), or appropriate scrambled controls (miR-Ctrl or anti-miR-Ctrl). (C) Cell cycle analysis performed in HT29, HCT116, and RKO cells treated as in B; the percentage of cells in each phase is reported together with the results of FACS acquisitions. (D) Immunoblot of proliferation markers in the cell lines transfected as in B; relative protein fold change, obtained by densitometric analysis and normalization to β-actin, is reported below the corresponding band; *P ≤ .05. (E) Representative images of wound-healing assay after crystal violet staining (upper panel); vertical lines represent the initial wound edges. Graphical representation of relative wound closure (residual wound area) assessed 24 hours after cell transfection (lower panel). Dotted lines highlight the wound areas right after the scratch (0 hour), as controls. All data are represented as means ± SD from at least three independent experiments performed in triplicates; n.s., not significant; *P ≤ .05; **P ≤ .01.
Figure 4
Figure 4
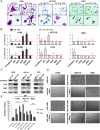
miR-130b expression is linked to the EMT-like phenotype and angiogenesis. (A) Morphologic features of cells transfected with scrambled controls, miR-130b mimic, and miR-130b inhibitor were evaluated after hematoxylin and eosin staining; the arrows point out some remarkable phenotypic characteristics (x40 and x100 magnifications). (B) qRT-PCR analysis of some EMT-associated genes in the CRC cell lines transfected as reported. mRNA levels detected in scrambled-transfected cells, used as calibrators, are indicated as red lines. (C) Western blot analysis for the indicated markers performed in HT29, HCT116, and RKO cells transfected as in A. Densitometric analysis is reported below the bands; *P ≤ .05. (D) Phase-contrast images of tube-like structures produced by HUVECs after incubation with collected CM from the same set of samples. Where indicated, bevacizumab (250 µg/ml) was added to the CM. (E) The histogram reports the results of the tube formation assay as mean number of tubes in at least 10 low-power fields; serum-free medium was used as negative control. Data are represented as means ± SD of at least three independent experiments performed in triplicate. *P ≤ .05; **P ≤ .01.
Figure 5
Figure 5
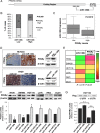
miR-130b negatively regulates PPARγ in vivo and in vitro. (A) Schematic representation of human PPARG-mRNA: two specific highly conserved miR-130b binding sites are located in the coding region and in 3′UTR. (B) The graph illustrates the inverse correlation between miR-130b and PPARγ in the CRC samples; the number of patients of each group is reported (P = .005; Fisher exact test). (C) Average fold change of miR-130b in PPARγ-low (n = 49) versus PPARγ-high (n = 31) CRC samples (P = .0018; paired t test). (D) PPARγ protein levels assessed in HCT116- and HT29-derived xenografts injected as depicted. Scale bars, 200 µm. (E) Color map of miR-130b and PPARγ expression levels in the CRC cell lines. Pearson correlation coefficient (R) and P value are indicated below the graph. (F) Western blot analysis of PPARγ in cells transfected with miR-130b mimic, miR-130b inhibitor, or scrambled controls; the histogram reports the protein fold change with respect to scrambled-transfected cells. (G) Immunoblot detection of Flag-epitope in HCT116 co-transfected with the anti-miR-130b or scrambled miRNA and the expression vectors +3′UTR or -3′UTR containing, respectively, the Flag-tagged PPARG-cDNA fused or not with its 3′UTR. Transfection efficiency was evaluated by using CMV-LacZ expression vector. Data are represented as means ± SD of at least two independent experiments. *P ≤ .05; **P ≤ .01.
Figure 6
Figure 6
PPARγ is a functionally relevant downstream target of miR-130b. (A) Plate colony-forming assay performed in HCT116 transfected with anti-miR-130b alone or in combination with shPPARG and stained with crystal violet (left panel); the histogram reports colony areas (right panel). (B) FACS analysis of cell cycle performed on cells treated as in A. (C) Western blot analysis of PPARγ and some proliferation markers; fold changes are reported below each band. (D) Number of invading cells measured in at least five fields of the transwell migration assay. (E) Tube-like structures produced by HUVECs after incubation with collected CM from the same set of samples; the average of tube number and length is reported in the histograms. (F) Immunoblot analysis of the indicated EMT and angiogenic markers. In all experiments, cells were co-transfected with scrambled shRNA and/or scrambled miRNA as controls. Data are represented as means ± SD of at least four independent experiments conducted in triplicates. *P ≤ .05; **P ≤ .01. (G) A schematic and simplified representation of the cross talks between PPARG and miR-130b in CRC progression. miR-130b up-regulation leads to PPARγ suppression modulating proliferation, EMT, invasion, and angiogenesis. These effects could explain the worse prognosis of CRC patients exhibiting high miR-130b levels. The symbol “#” indicates that PPARγ endogenous levels influence target genes even in the absence of a specific ligand; “?” indicates processes and/or pathways that require further investigations.

References

    1. Schoen RE, Pinsky P, Weissfeld JL, Yokochi LA, Church T, Laiyemo AO, Bresalier R, Andriole GL, Buys SS, Crawford ED, et al. Colorectal-cancer incidence and mortality with screening flexible sigmoidoscopy. N Engl J Med. 2012;366:2345–2357. - PMC - PubMed
    1. Dean M. Cancer as a complex developmental disorder—nineteenth Cornelius P. Rhoads Memorial Award Lecture. Cancer Res. 1998;58:5633–5636. - PubMed
    1. Stefani G, Slack FJ. Small non-coding RNAs in animal development. Nat Rev Mol Cell Biol. 2008;9:219–230. - PubMed
    1. Garzon R, Calin GA, Croce CM. MicroRNAs in cancer. Annu Rev Med. 2009;60:167–179. - PubMed
    1. Lehrke M, Pascual G, Glass CK, Lazar MA. Gaining weight: the Keystone Symposium on PPAR and LXR. Genes Dev. 2005;19:1737–1742. - PMC - PubMed

Publication types

MeSH terms