. 2013 Sep 3:7:47.
doi: 10.3389/fnsys.2013.00047. eCollection 2013.

Different correlation patterns of cholinergic and GABAergic interneurons with striatal projection neurons

Affiliations

Different correlation patterns of cholinergic and GABAergic interneurons with striatal projection neurons

Avital Adler et al. Front Syst Neurosci. .

Abstract

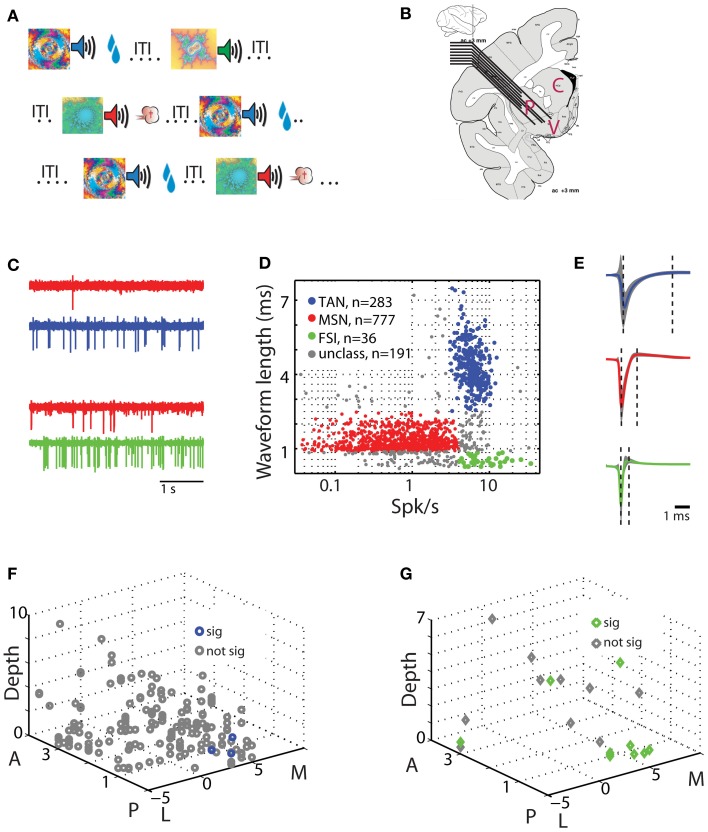
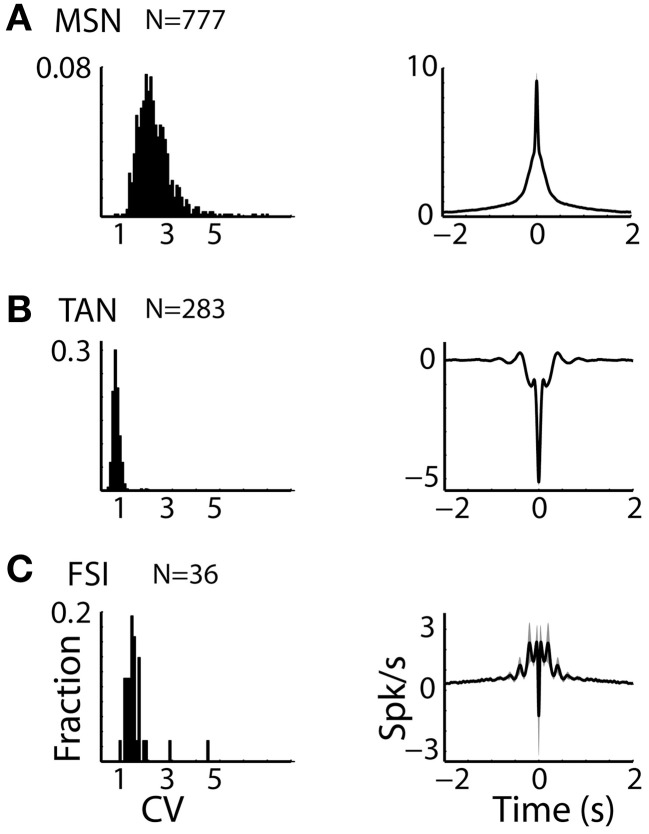
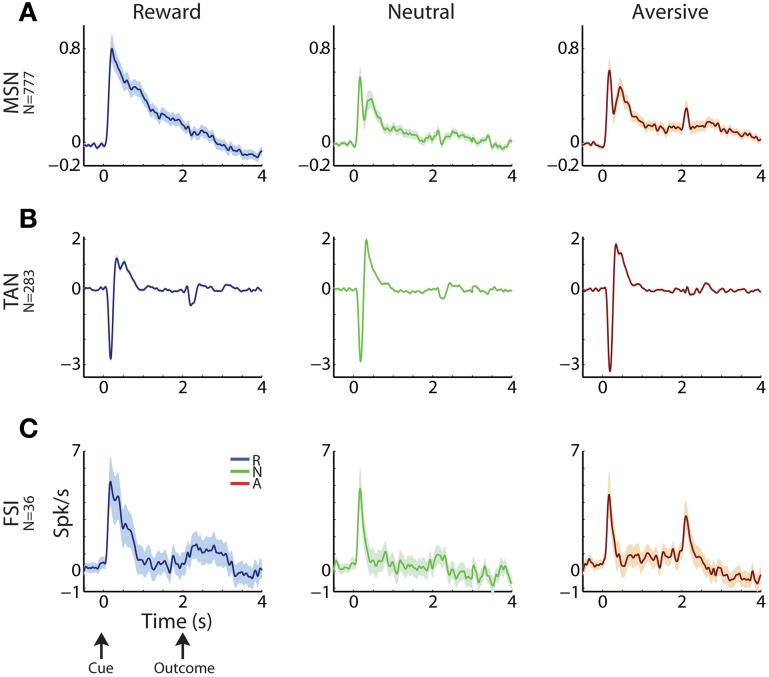
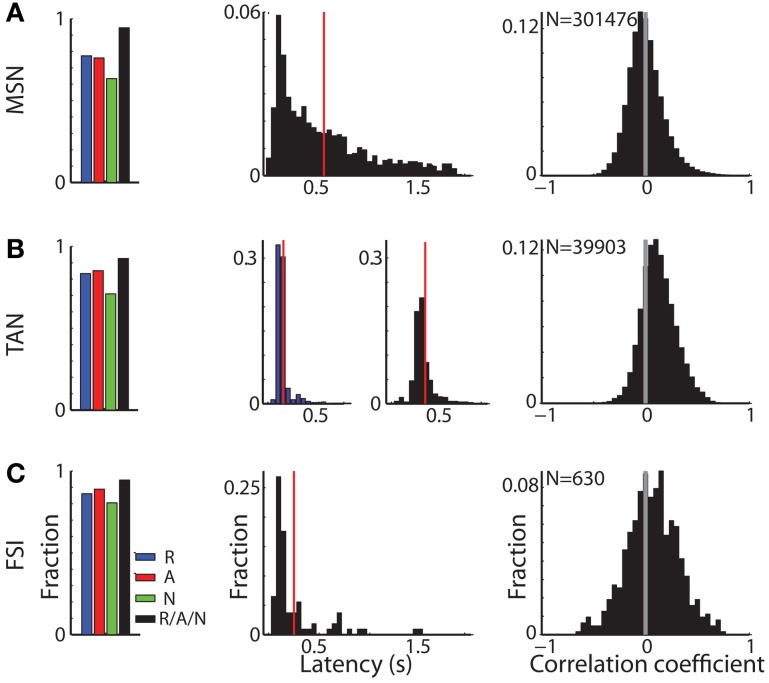
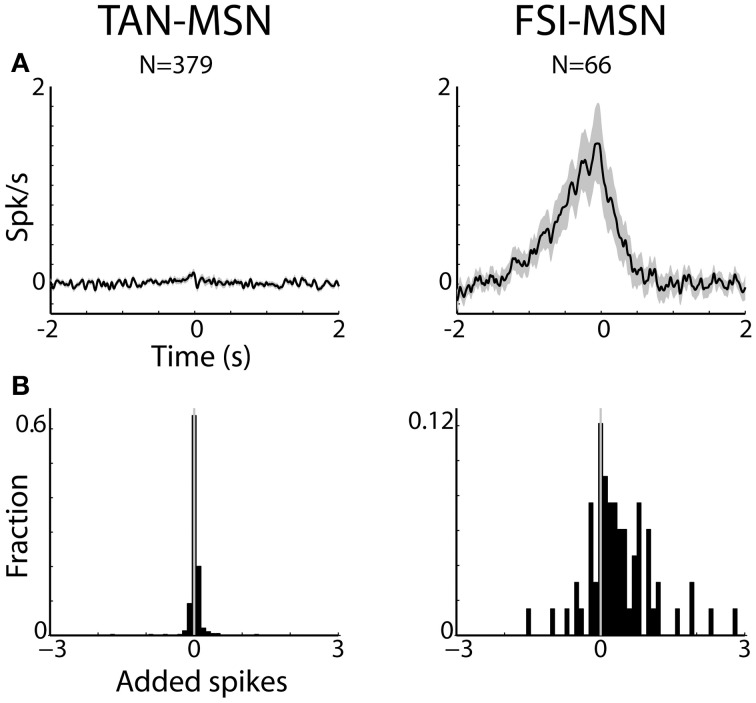
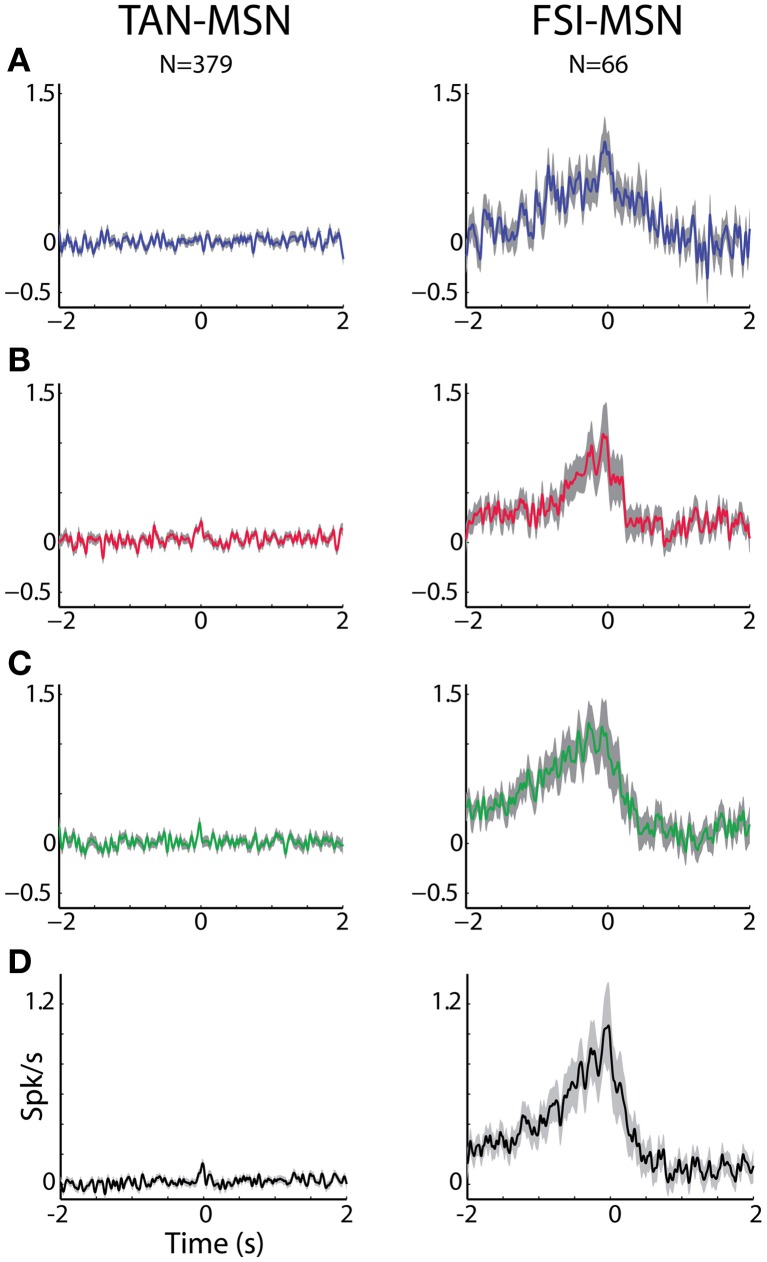
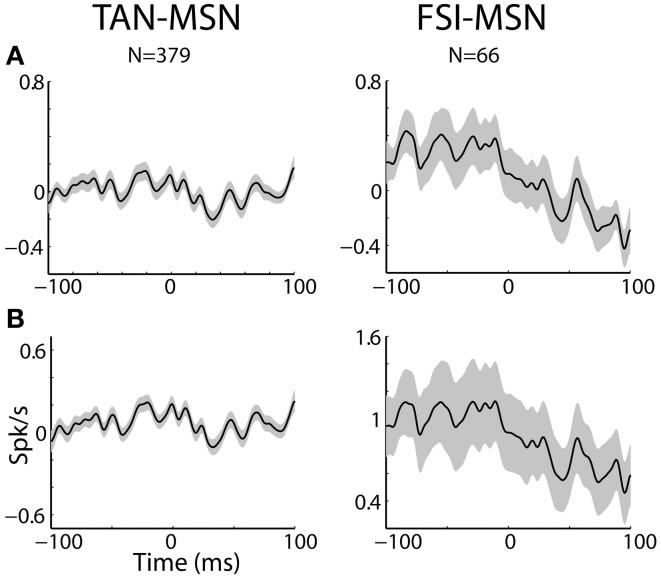
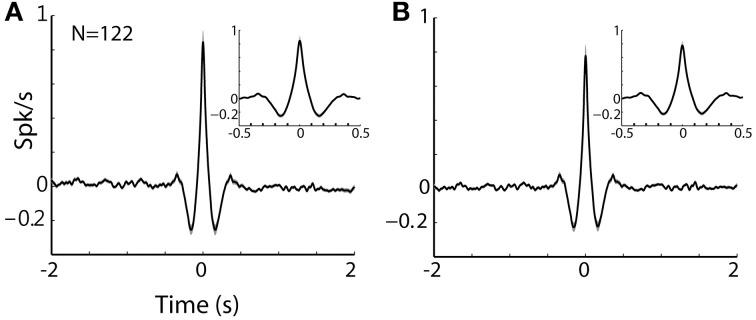
The striatum is populated by a single projection neuron group, the medium spiny neurons (MSNs), and several groups of interneurons. Two of the electrophysiologically well-characterized striatal interneuron groups are the tonically active neurons (TANs), which are presumably cholinergic interneurons, and the fast spiking interneurons (FSIs), presumably parvalbumin (PV) expressing GABAergic interneurons. To better understand striatal processing it is thus crucial to define the functional relationship between MSNs and these interneurons in the awake and behaving animal. We used multiple electrodes and standard physiological methods to simultaneously record MSN spiking activity and the activity of TANs or FSIs from monkeys engaged in a classical conditioning paradigm. All three cell populations were highly responsive to the behavioral task. However, they displayed different average response profiles and a different degree of response synchronization (signal correlation). TANs displayed the most transient and synchronized response, MSNs the most diverse and sustained response and FSIs were in between on both parameters. We did not find evidence for direct monosynaptic connectivity between the MSNs and either the TANs or the FSIs. However, while the cross correlation histograms of TAN to MSN pairs were flat, those of FSI to MSN displayed positive asymmetrical broad peaks. The FSI-MSN correlogram profile implies that the spikes of MSNs follow those of FSIs and both are driven by a common, most likely cortical, input. Thus, the two populations of striatal interneurons are probably driven by different afferents and play complementary functional roles in the physiology of the striatal microcircuit.

Keywords: crosscorrealtion; interneurons; physiology; spikes; striatum.


Figures

Figure 1
Figure 1
Behavioral task and physiological recording methods. (A) Classical conditioning paradigm. Visual cues were presented for 2 s and predicted the delivery of food (reward trials, upper row), air puff (aversive trials, third row), or only sound (neutral trials, second row). The trial outcome epoch was followed by a variable inter trial interval (ITI) of 5–6 s. (B) Recording sites: a representative coronal section +3 mm from the anterior commissure [adapted from Martin and Bowden, 2000]. Two to eight electrodes were advanced separately into one or two of the three sub regions of the striatum. P for putamen, C for caudate, and V for ventral striatum. (C) An example of simultaneously recorded pairs of units from the putamen. Each row is a 4 s analog trace of extracellular recording from a single electrode filtered between 300 and 6000 Hz. First two rows are MSN (red) and TAN (blue) recorded simultaneously, second two rows are MSN (red) and FSI (green) recorded simultaneously. (D) Classification of striatal neuron subtypes. Each dot represents a single neuron colored according to its subtype. Red, MSN; blue, TAN; green, FSI; gray, cells not categorized in either group. Abscissa: firing rate in Hz (logarithmic scale). Ordinate: spike waveform duration (ms). (E) Spike waveform averaged over all cells (average ± STD, line and shaded envelope, respectively) in each of the clusters. Waveform length was measured as the distance between the first negative peak and the next positive peak (left and right dashed lines, respectively). Upper row; TAN. Middle row: MSN. Third row: FSI. Same color coding as in (D). (F) Spatial layout of TAN-MSN pairs. Each point represents a single pair. Abscissa: coordinates in the horizontal plane (in mm); M, medial; L, lateral; zero in the center of the putamen in our recordings. Ordinate: coordinates in the peri-sagittal plane (in mm); A, anterior; P, posterior; zero is coronal section AC0 (AC, anterior commissure). Z-axis: depth from entry to the striatum (in mm) of the TAN in the TAN-MSN pair. Blue and gray, location of pairs with significant and not significant correlations, respectively. (G) Spatial layout of FSI-MSN pairs. Same conventions as in (F).
Figure 2
Figure 2
Striatal MSNs, TANs, and FSIs display different firing patterns. (A) MSN discharge pattern. Left subplot: Distributions of the CV of the ISIs of striatal MSN neurons. Abscissa: CV. Ordinate: fraction of cells. Right subplot: Average ± SEM (solid line and envelope) auto cross correlation histogram of MSNs normalized by the average discharge rate and averaged over all cells. N is for number of neurons. (B) TAN discharge pattern. Same conventions as in (A). (C) FSI discharge pattern. Same conventions as in (A).
Figure 3
Figure 3
Striatal MSNs, TANs, and FSIs display different response profiles. (A) MSN response profile. Average response ± SEM (solid line and envelope) to cue presentation (0 s) and outcome delivery (2 s). Ordinate: firing rate in Hz normalized by the ITI discharge rate. Blue, reward events; red, aversive events; green, neutral events. N is for number of cells. (B) TAN response profile. Same conventions as in (A). (C) FSI response profile. Same conventions as in (A).
Figure 4
Figure 4
Different response characteristics of striatal MSNs, TANs, and FSIs. (A) MSN response profile. Left subplot: distribution of MSNs that had a significant response. Blue, red, and green bars: fraction of cells that had a significant response for reward, aversive, and neutral events, respectively. Black bar: fraction of cells that had a significant response to at least one of the task events. Second subplot: distribution of response onset. Abscissa: time in seconds for significant increase in firing rate. Red line marks the average response onset time. Right subplot: distribution of the signal correlation between all (simultaneously and non-simultaneously recorded) MSN pairs. N is for number of pairs. (B) TAN response profile. Same conventions as in (A). In the second subplot: distribution of response onset, left and right columns: latency of significant decrease and increase in firing rate, respectively. (C) FSI response profile. Same conventions as in (A).
Figure 5
Figure 5
MSNs are differentially correlated with striatal interneurons. (A) Raw (with no normalization) cross correlation histograms (CCH) between pairs of striatal interneurons and MSNs averaged over all pairs. Average and SEM; black line and gray shaded envelope, respectively. Abscissa: time in seconds. The MSN (trigger cell) discharge is at time zero. Ordinate: conditional firing rate of the FSI and TAN (reference cell), given a spike of the MSN at time zero. Cross correlation histograms were computed with 1 ms bins for ±2 s around the trigger spike and were smoothed using a Gaussian (SD of 10 ms). Left subplot: TAN-MSN. Right subplot: FSI-MSN. N stands for the number of simultaneously recorded pairs. (B) Distribution of the average number of added spikes of the reference (MSN) cell in the corrected CCHs around the time window of ±1.5 s. Abscissa: number of added spikes. Ordinate: ratio of pairs (note the different y-scales).
Figure 6
Figure 6
MSN-FSI and MSN-TAN correlation is not dependent on task event. (A) Normalized CCH (using the PSTH predictor) averaged over all interneurons to MSN pairs for the reward event. The MSN (trigger cell) discharge is at time zero. Ordinate: conditional firing rate of the TAN or FSI (reference cell), given a spike of the interneuron at time zero. (B) Normalized CCH averaged over all interneurons to MSN pairs for the aversive event. Same conventions as in (A). (C) Normalized CCH averaged over all interneurons to MSN pairs for the neutral event. Same conventions as in (A). (D) Normalized CCH (using the PSTH predictor) averaged over behavioral events for all interneurons to MSN pairs.
Figure 7
Figure 7
MSN-interneuron pairs do not display narrow peaks or troughs in their cross correlation histograms. (A) Raw (with no normalization) cross correlation histograms (CCH) between pairs of striatal interneurons and MSNs averaged over all pairs. Black line and gray shaded envelope display average and SEM values, respectively. Cross correlation histograms were computed with 1ms bins for ±100 ms around the trigger spike and were smoothed using a Gaussian (SD of 2 ms). The MSN (trigger cell) discharge is at time zero. Ordinate: conditional firing rate (spikes/s) of the FSI and TAN (reference cell), given a spike of the MSN at time zero. Abscissa: Time lag (in ms) around the discharge of the trigger cell. Axis labels on lower left subplots apply for all subplots. (B) Normalized CCH (using the PSTH predictor) averaged over behavioral events for all interneurons to MSN pairs.
Figure 8
Figure 8
TAN-TAN pairs display narrow peaks in their CCHs. (A) Raw (with no normalization) cross correlation histograms (CCH) between pairs of striatal TANs averaged over all simultaneously recorded pairs. Black line and gray shaded envelope display average and SEM values, respectively. Cross correlation histograms were computed with 1 ms bins for ±2000 ms around the trigger spike and were smoothed using a Gaussian (SD of 10 ms). Ordinate: conditional firing rate of the reference cell, given a spike of the trigger cell at time zero. Inset: CCH at shorter time scale (±500 ms around the trigger spike). (B) Normalized CCH (using the PSTH predictor) averaged over behavioral events for all TAN to TAN pairs.

References

    1. Abeles M. (1982a). Quantification, smoothing, and confidence limits for single- units' histograms. J. Neurosci. Methods 5, 317–325 10.1016/0165-0270(82)90002-4 - DOI - PubMed
    1. Abeles M. (1982b). Local Cortical Circuits. Berlin; Heidelberg; New York: Springer-Verlag
    1. Adler A., Finkes I., Katabi S., Prut Y., Bergman H. (2013). Encoding by synchronization in the primate striatum. J. Neurosci. 33, 4854–4866 10.1523/JNEUROSCI.4791-12.2013 - DOI - PMC - PubMed
    1. Adler A., Katabi S., Finkes I., Israel Z., Prut Y., Bergman H. (2012). Temporal convergence of dynamic cell assemblies in the striato-pallidal network. J. Neurosci. 32, 2473–2484 10.1523/JNEUROSCI.4830-11.2012 - DOI - PMC - PubMed
    1. Aertsen A. M., Gerstein G. L. (1985). Evaluation of neuronal connectivity: sensitivity of cross-correlation. Brain Res. 340, 341–354 10.1016/0006-8993(85)90931-X - DOI - PubMed