. 2013 Oct;20(10):1264-71.
doi: 10.1016/j.acra.2013.07.001.

Detecting radiation-induced injury using rapid 3D variogram analysis of CT images of rat lungs

Affiliations

Detecting radiation-induced injury using rapid 3D variogram analysis of CT images of rat lungs

Richard E Jacob et al. Acad Radiol. 2013 Oct.

Abstract

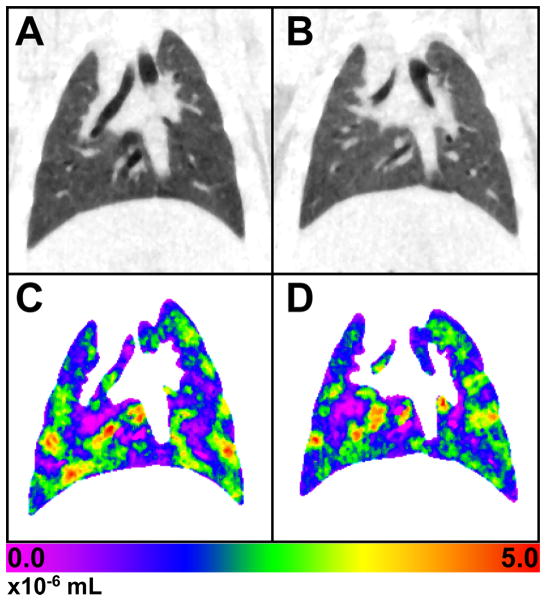
Rationale and objectives: To investigate the ability of variogram analysis of octree-decomposed computed tomography (CT) images and volume change maps to detect radiation-induced damage in rat lungs.

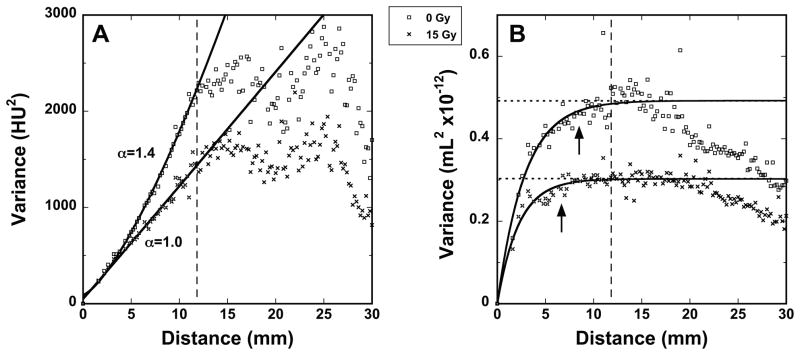
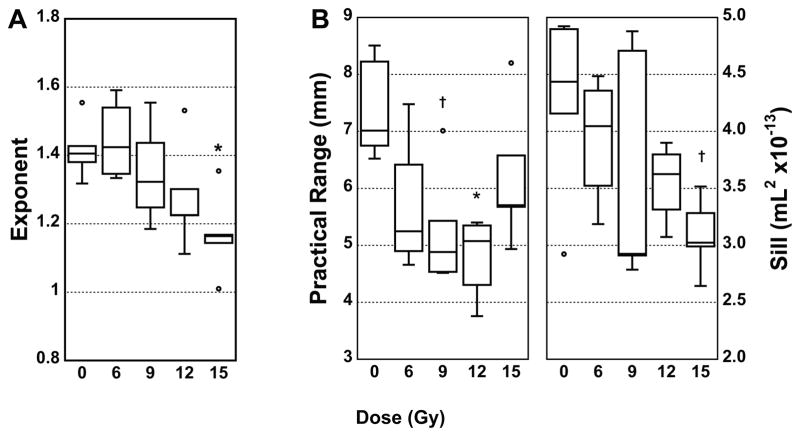
Materials and methods: The lungs of female Sprague-Dawley rats were exposed to one of five absorbed doses (0, 6, 9, 12, or 15 Gy) of gamma radiation from a Co-60 source. At 6 months postexposure, pulmonary function tests were performed and four-dimensional (4D) CT images were acquired using a respiratory-gated microCT scanner. Volume change maps were then calculated from the 4DCT images. Octree decomposition was performed on CT images and volume change maps, and variogram analysis was applied to the decomposed images. Correlations of measured parameters with dose were evaluated.

Results: The effects of irradiation were not detectable from measured parameters, indicating only mild lung damage. Additionally, there were no significant correlations of pulmonary function results or CT densitometry with radiation dose. However, the variogram analysis did detect a significant correlation with dose in both the CT images (r = -0.57, P = .003) and the volume change maps (r = -0.53, P = .008).

Conclusion: This is the first study to use variogram analysis of lung images to assess pulmonary damage in a model of radiation injury. Results show that this approach is more sensitive to detecting radiation damage than conventional measures such as pulmonary function tests or CT densitometry.

Keywords: CT imaging; Octree; irradiation; lung; variogram.


Figures

Figure 1
Figure 1
Octree decomposition. Each cube may be decomposed into eight smaller cubes, or octants. Decomposition of cubes is applied iteratively when specific conditions regarding contents of a cube are met.
Figure 2
Figure 2
Representative coronal slice at functional residual capacity (FRC) of: A) a control rat, and B) a rat exposed to 15 Gy. C and D are maps of the volume change between FRC and peak inspiratory volume (PIV) for the control and exposed rats, respectively. There are few, if any, observable differences between the images of the control and 15 Gy rats. The color scale is in units of 10−6 mL.
Figure 3
Figure 3
A) Representative octree decomposition, with 2×2×2 (left), 4×4×4 (center), and 8×8×8 (right) octree cubes. 8×8×8 cubes are 1.6 mm in each dimension. The smaller cubes generally define edges, airways, and vascular features; thus, only the 8×8×8 cubes are retained for analysis. B) Histogram showing the percentage of lung occupied by each box size at each HU value. Bin width was 10 HU.
Figure 4
Figure 4
Representative variograms from 0 Gy and 15 Gy rats showing the average HU variance of 8×8×8 cubes vs. distance of separation. The distance dmax for which the variogram is expected to be valid is indicated by the dashed line. Curve fits were applied to the range ddmax. A) Variograms from CT images at functional residual capacity (FRC), with the corresponding exponent α (see Equation 1), with resulting α values of 1.38±0.05 and 1.01±0.09 for the 0 Gy and 15 Gy rats, respectively. B) Variograms from the volume maps. The dotted lines represent S and the arrows indicate the extent of R (see Equation 2). For the 0 Gy and 15 Gy rats, R (in mm) is 8.51±0.83 and 6.61±0.53 and S (in 10−12 mL) is 0.49±0.01 and 0.30±0.01, respectively.
Figure 5
Figure 5
A: Variogram group averages of: A: CT images at functional residual capacity (FRC) following the form of Equation 1, and B: 4DCT volume change maps following the form of Equation 2.
Figure 6
Figure 6
Box plots showing variogram parameters versus dose. A: The exponent α (see Equation 1) from the CT images at functional residual capacity (FRC). B: The range (R) and sill (S) from the volume change maps (see Equation 2). †p<0.05; *p<0.01.

References

    1. Mets OM, de Jong PA, van Ginneken B, et al. Quantitative computed tomography in COPD: possibilities and limitations. Lung. 2012;190:133–145. - PMC - PubMed
    1. Lynch DA, Travis WD, Muller NL, et al. Idiopathic interstitial pneumonias: CT features. Radiology. 2005;236:10–21. - PubMed
    1. Subramaniam K, Hoffman EA, Tawhai MH. Quantifying Tissue Heterogeneity using Quadtree Decomposition. 34th Annual International Conference of the IEEE EMBS; San Diego, CA, USA. 2012. pp. 4079–4082. - PubMed
    1. Dua S, Kandiraju N, Chowriappa P. Region quad-tree decomposition based edge detection for medical images. Open Med Inform J. 2010;4:50–57. - PMC - PubMed
    1. Gringarten E, Deutsch CV. Variogram interpretation and modeling. Math Geol. 2001;33:507–534.

Publication types

MeSH terms