

Ancel Keys Lecture: Adventures (and misadventures) in understanding (and reducing) disparities in stroke mortality
- PMID: 24029634
- PMCID: PMC3878050
- DOI: 10.1161/STROKEAHA.113.002113
Ancel Keys Lecture: Adventures (and misadventures) in understanding (and reducing) disparities in stroke mortality
Abstract
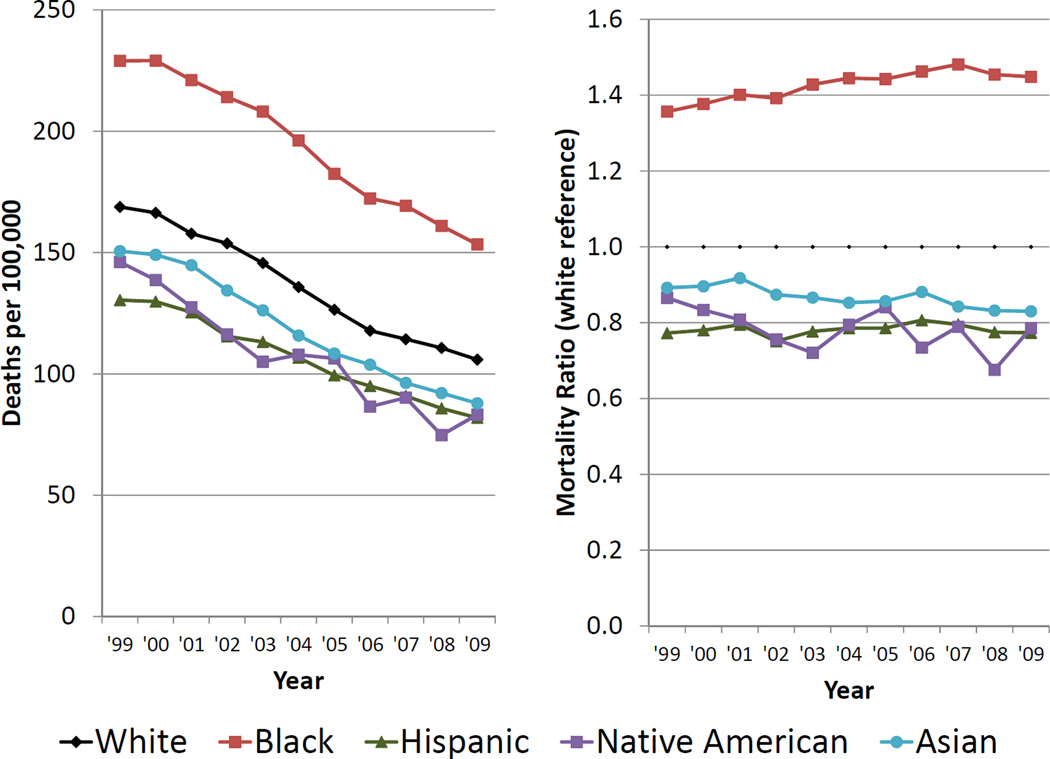
Background and Purpose: Racial and geographic disparities in stroke mortality have been documented for over 50 years, and for those aged 45 to 64 are among the largest for any disease. The causes of the disparities have been mysterious; however, investments by NINDS, NHLBI and CDC are now providing insights into the causes.
Methods: Complementary study designs provide information on different aspects of the disparities. Vital statistics data track temporal patterns in stroke mortality, an objective index of the success in overcoming the disparities. Surveillance studies assess of the contributions of incidence versus case fatality to the disparities, a distinction critical to guide efforts to reduce the disparities. Finally, cohort studies give insights to the contribution of specific risk factors to disparities in either incidence or case fatality, allowing targeted interventions.
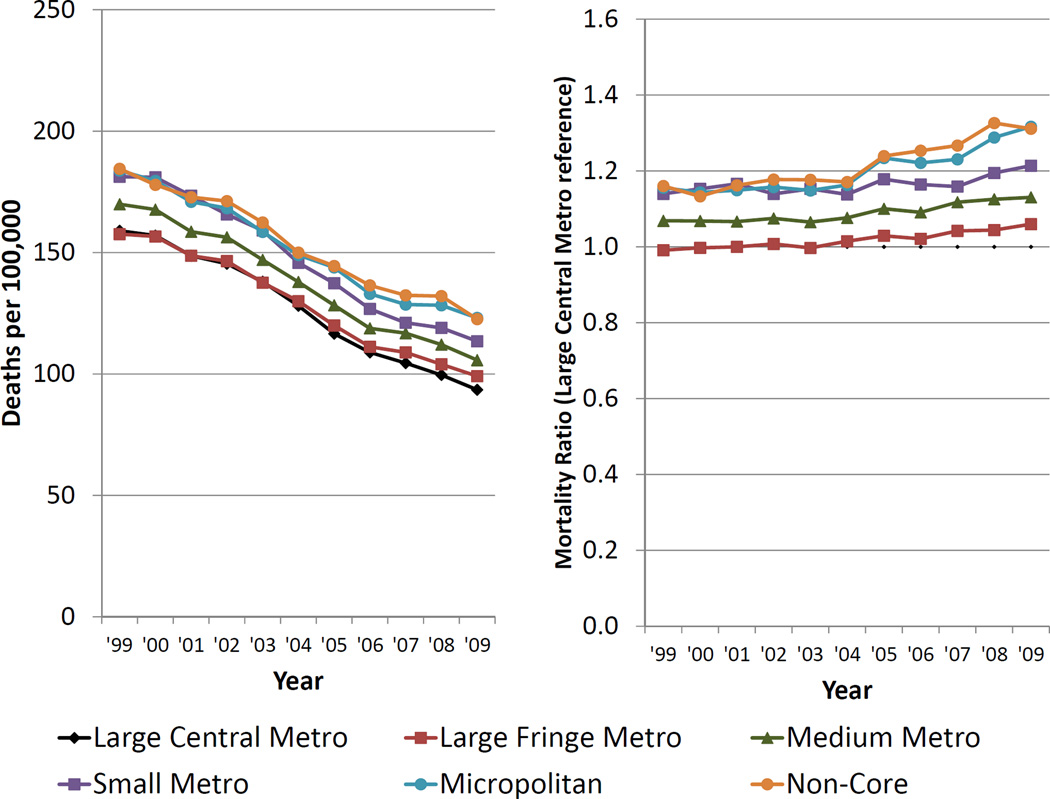
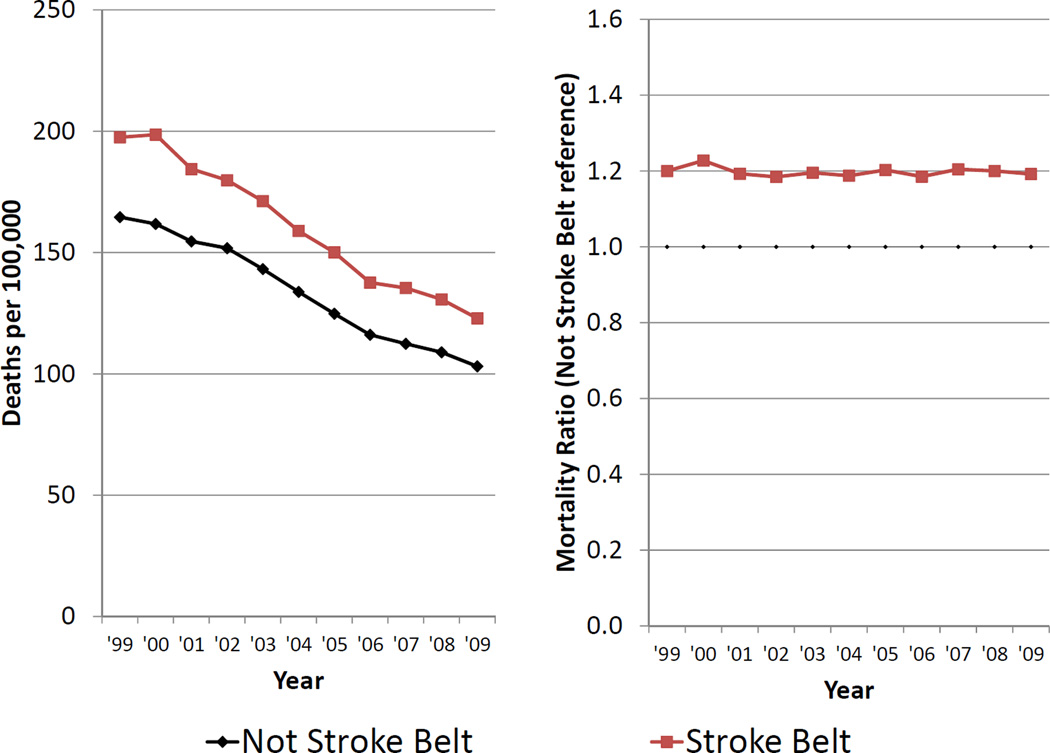
Results: While deaths from stroke mortality declined by a third in the most recent eleven years, there has been a 35% increase in the black-white disparity and little change in geographic disparities. Surveillance studies suggest that the black-white disparity is primarily attributable to differences in incidence, and also have potentially unmasked Hispanic-white differences in incidence that are not apparent in mortality trends. Longitudinal cohort studies are suggesting multiple targets for intervention such as a multi-dimensional impact of blood pressure on the black-white differences.
Conclusion: After suffering these disparities over a half-century, information is now emerging to allow us to better understand the underpinnings of the disparities and potentially enter a new era of targeted interventions to reduce these disparities.
Keywords: geography; mortality; race; rural health; stroke; urban health.
Figures
References
-
- Services USDoHaH. Health people 2010: Understanding and improving health. 2000
-
- Minority health and health disparities research and education act. 2000;106–525:2498.
-
- Gillum RF. Stroke mortality in blacks. Disturbing trends. Stroke a journal of cerebral circulation. 1999;30:1711–1715. - PubMed
-
- Howard G, Howard VJ, Geographic REf. Racial Differences in Stroke I. Ethnic disparities in stroke: The scope of the problem. Ethnicity & disease. 2001;11:761–768. - PubMed
Publication types
MeSH terms
Grants and funding
LinkOut - more resources
Full Text Sources
Other Literature Sources
Medical
