. 2013 Sep 15;27(18):1959-73.
doi: 10.1101/gad.223339.113. Epub 2013 Sep 12.

Inflammation-mediated skin tumorigenesis induced by epidermal c-Fos

Affiliations

Inflammation-mediated skin tumorigenesis induced by epidermal c-Fos

Eva M Briso et al. Genes Dev. .

Abstract

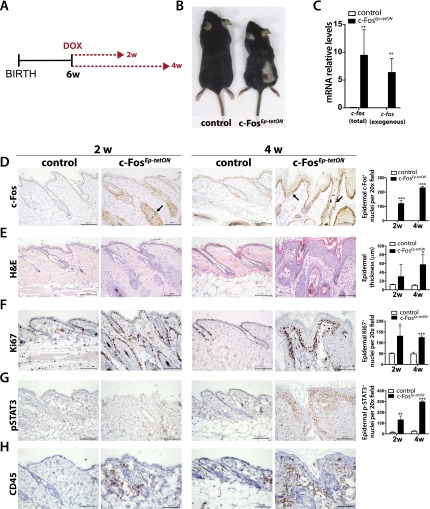
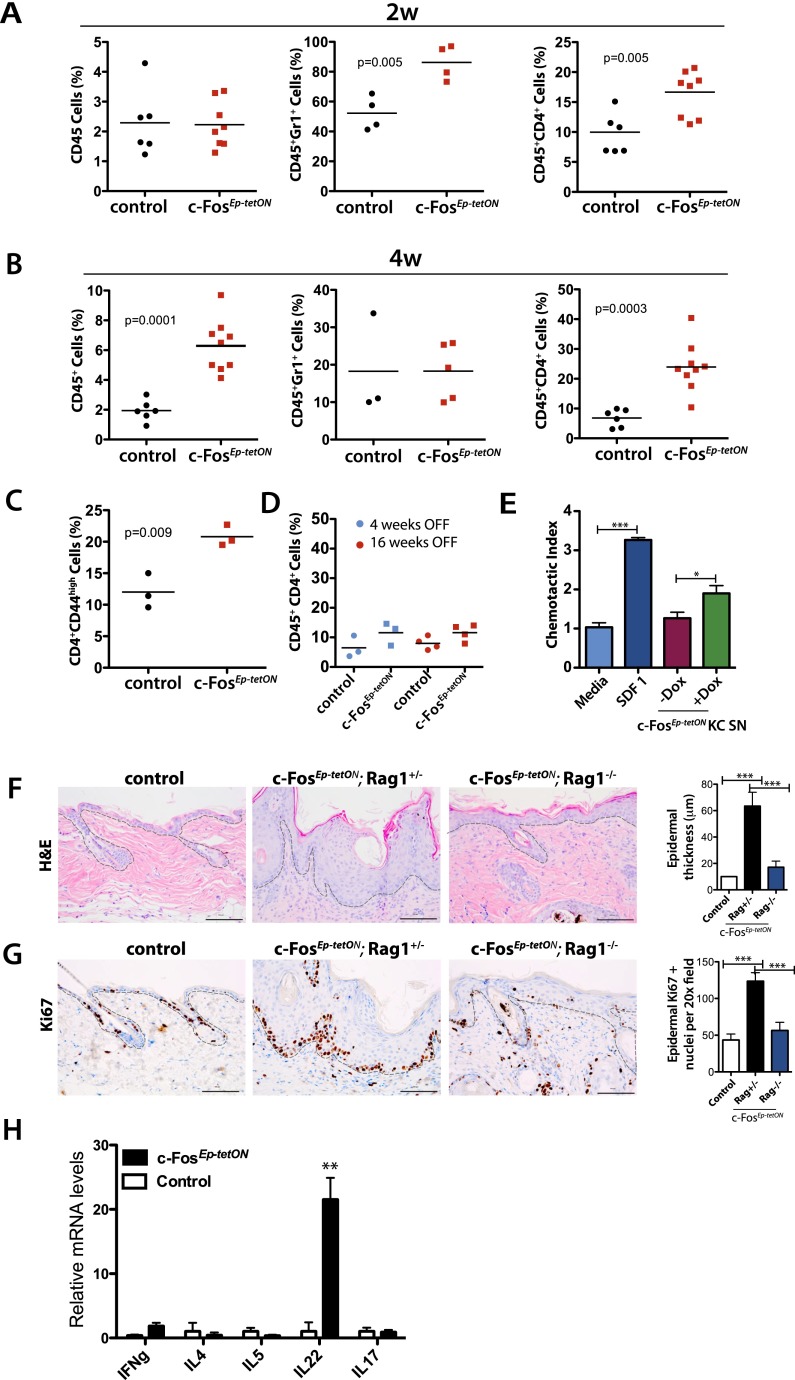
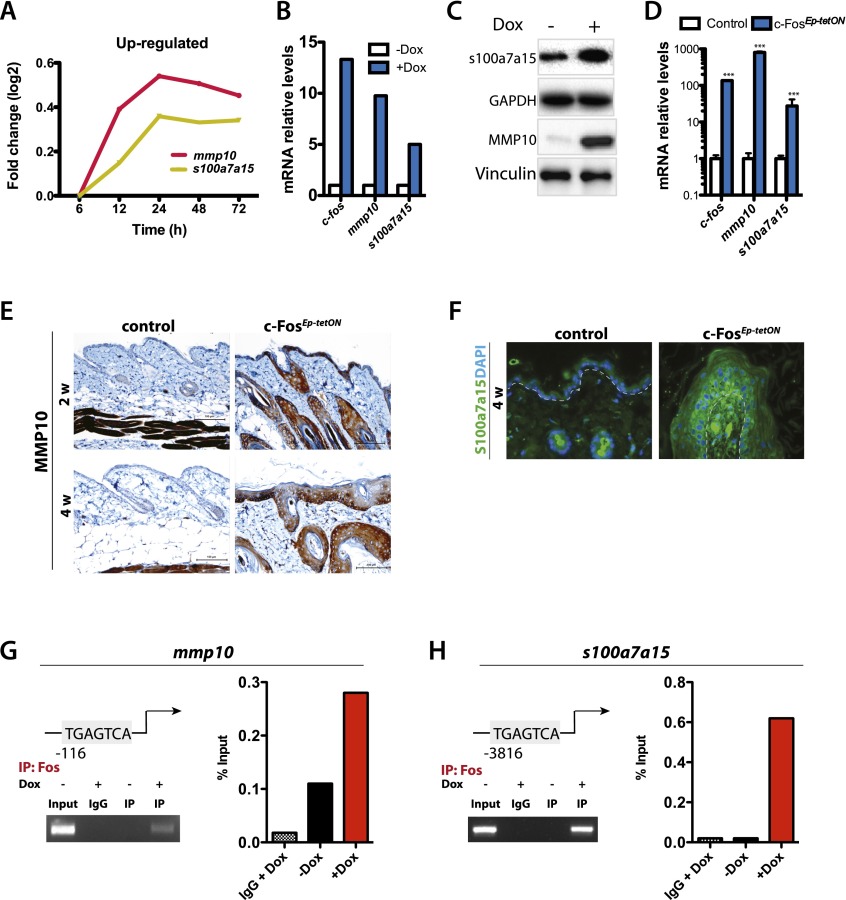
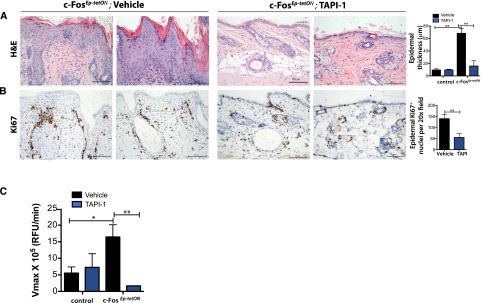
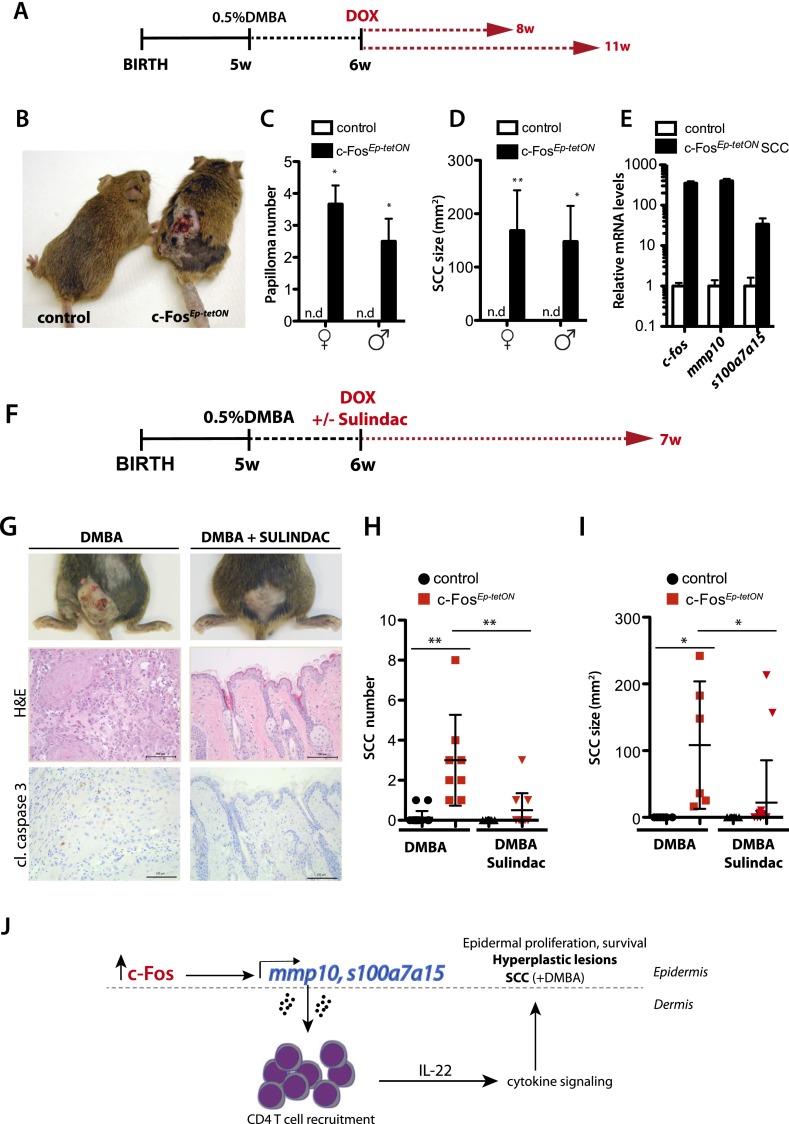
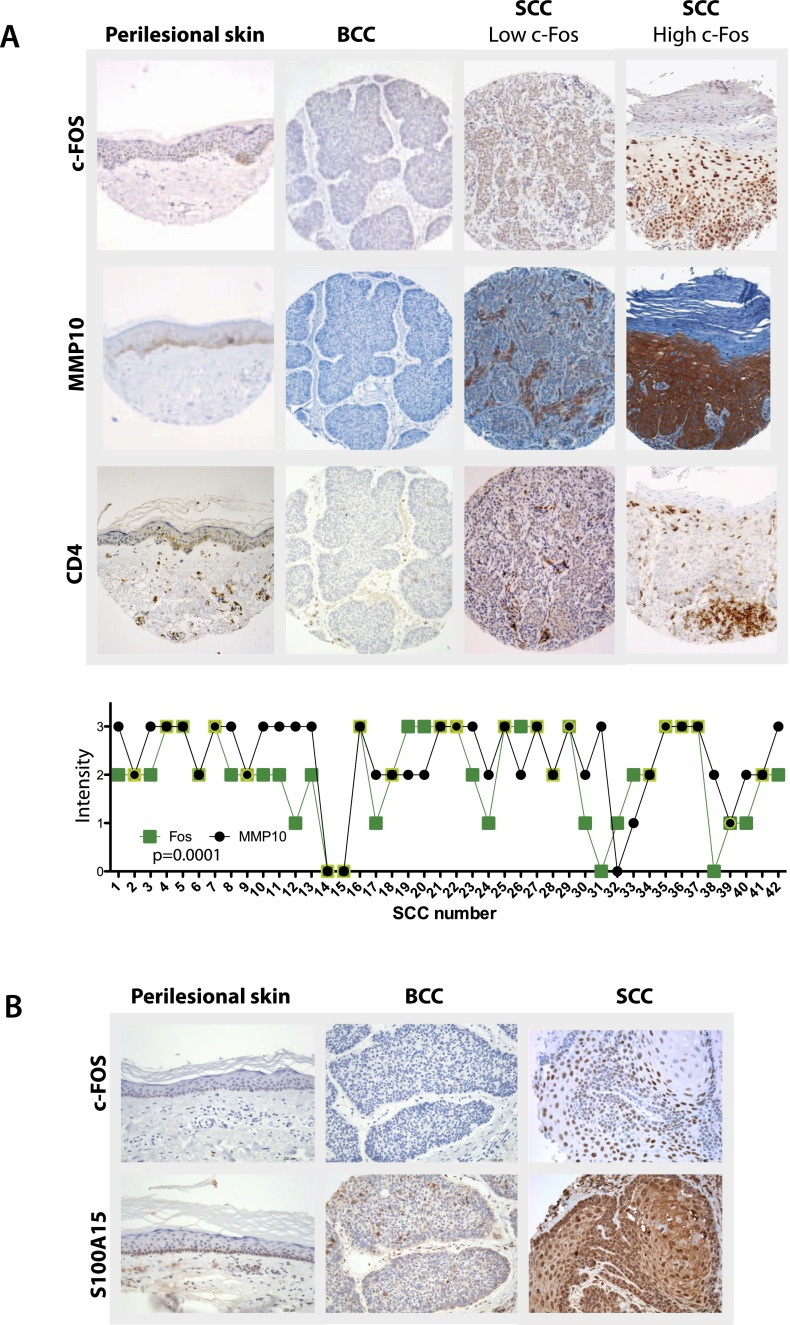
Skin squamous cell carcinomas (SCCs) are the second most prevalent skin cancers. Chronic skin inflammation has been associated with the development of SCCs, but the contribution of skin inflammation to SCC development remains largely unknown. In this study, we demonstrate that inducible expression of c-fos in the epidermis of adult mice is sufficient to promote inflammation-mediated epidermal hyperplasia, leading to the development of preneoplastic lesions. Interestingly, c-Fos transcriptionally controls mmp10 and s100a7a15 expression in keratinocytes, subsequently leading to CD4 T-cell recruitment to the skin, thereby promoting epidermal hyperplasia that is likely induced by CD4 T-cell-derived IL-22. Combining inducible c-fos expression in the epidermis with a single dose of the carcinogen 7,12-dimethylbenz(a)anthracene (DMBA) leads to the development of highly invasive SCCs, which are prevented by using the anti-inflammatory drug sulindac. Moreover, human SCCs display a correlation between c-FOS expression and elevated levels of MMP10 and S100A15 proteins as well as CD4 T-cell infiltration. Our studies demonstrate a bidirectional cross-talk between premalignant keratinocytes and infiltrating CD4 T cells in SCC development. Therefore, targeting inflammation along with the newly identified targets, such as MMP10 and S100A15, represents promising therapeutic strategies to treat SCCs.

Keywords: AP-1; CD4 T cell; c-Fos; cancer; inflammation; skin.


Figures

Figure 1.
Figure 1.
Inducible expression of c-fos in the epidermis of adult mice promotes epidermal hyperplasia with increased proliferation. (A) Scheme of the experimental design: Six-week-old (6w) mice were fed with Dox (0.5 g/L) in the drinking water, and the analyses were performed after 2 and 4 wk (2w and 4w). (B) Picture of a representative control (n = 11) (left) and a c-FosEp-tetON (n = 17) (right) mouse is shown at 4 wk of inducible c-fos expression with Dox in the drinking water. (C) Total c-Fos and exogenous c-Fos-Flag mRNA expression analyses in the back skin of control and c-FosEp-tetON mice at 4 wk of inducible c-fos expression (n = 3). Mean ± SD. (D, left) c-Fos immunostainings of back skin of control (littermate) and c-FosEp-tetON mice at 2 and 4 wk (n = 3) of inducible c-fos expression. (Right panel) Epidermal c-Fos positive nuclei IHC quantification. (E, left) H&E staining of the back skin of c-FosEp-tetON and control mice at 2 and 4 wk of inducible c-fos expression. (Right panel) Epidermal thickness quantification. (F, left) Ki67 immunostainings of the back skin of control and c-FosEp-tetON mice at 2 wk (n = 3) and 4 wk (n = 3) of inducible c-fos expression. (Right panel) Epidermal Ki67-positive nucleus IHC quantification. Mean ± SD. (G, left) p-STAT3 immunostainings of the back skin of control and c-FosEp-tetON mice at 2 wk (n = 3) and 4 wk (n = 3) of inducible c-fos expression. (Right panel) Epidermal p-STAT3-positive nucleus IHC quantification. Mean ± SD. (H) CD45 immunostainings of the back skin of control and c-FosEp-tetON mice at 2 wk (n = 3) and 4 wk (n = 3) of inducible c-fos expression.
Figure 2.
Figure 2.
c-Fos expression induces skin inflammation characterized by chronic CD4 T-cell recruitment. (A) FACS (flow cytometry) analyses of the skin immune cell infiltrate (CD45+, CD45+CD4+, and CD45+Gr1+ populations) of control (n = 6) and c-FosEp-tetON (n = 9) mice after 2 wk of inducible c-fos expression. (B) FACS analyses of the skin immune cell infiltrate of control (n = 6) and c-FosEp-tetON (n = 9) mice at 4 wk of inducible c-fos expression. (C) FACS analyses of the immune cell infiltrate in the skin draining lymph nodes of CD4+/CD44+ cells from control and c-FosEp-tetON (n = 3) mice at 2 wk of inducible c-fos expression. (D) FACS analyses of the immune cell infiltrate (CD45+CD4+ population) in the skin of control and c-FosEp-tetON mice at 4 wk of inducible c-fos expression followed by 4 wk and 16 wk without Dox treatment. (E) Chemotaxis assay. CD4 T lymphocytes isolated from murine wild-type lymph nodes were activated for 5 h with anti-CD28 and anti-CD3 antibodies. Activated CD4 T lymphocytes were subjected to chemotaxis in a transwell assay using either medium alone, SDF-1 (10 ng/mL), or conditioned medium (CM) from control or c-FostetON keratinocytes cultured ±Dox and ±the recombinant protein S100a7a15. (F, right) Immunohistochemical analyses depicting H&E stainings of the back skin of control (Col-Fos+/+; K5rtTA+/+; Rag−/−) and c-FosEp-tetON [Col-Fos (+/KI); K5rtTA (+/T); Rag+/−] and seven c-FosEp-tetON Rag−/− mice [Col-Fos (+/KI); K5rtTA (+/T); Rag−/−] mice on Dox for 4 wk (n = 7, 4, or 10 males). Right: Epidermal thickness quantification of control, RAG1+/−, and RAG−/− c-FosEp-tetON mice. (G, right) Immunohistochemical analyses depicting Ki67 stainings of the back skin of control, c-FosEp-tetON; Rag+/−, and c-FosEp-tetON Rag−/− mice on Dox for 4 wk (n = 7, 4, or 10 males). (Left) Epidermal Ki67-positive nucleus quantification of control, c-FosEp-tetON; Rag+/−, and c-FosEp-tetON Rag−/− mice. (H) RT-qPCR expression analyses of mRNA of sorted CD4 T cells from the back skin of control and c-FosEp-tetON mice after 4 wk of Dox treatment (n = 3).
Figure 3.
Figure 3.
MMP10 and S100a7a15 are novel transcriptional targets of c-Fos. (A) Schematic representation of the two most up-regulated genes in a microarray expression analysis comparing in vitro cultured c-FostetON [coltetO-Fos (+/KI), Rosa-rtTA (+/KI)] keratinocytes treated ±Dox (1 mg/mL; n = 3) for 6, 12, 24, 48, and 72 h. (B) RT-qPCR expression analyses of c-fos, mmp10, and s100a7a15 mRNA in c-FostetON keratinocytes treated ±Dox (1 μg/mL; n = 3). (C) Immunoblot depicting S100a7a15 and MMP10 protein levels as well as vinculin and GAPDH as loading controls in c-FostetON keratinocytes treated ±Dox for 48 h. (D) RT-qPCR expression analyses of c-fos, mmp10, and s100a7a15 mRNA in control and c-FosEp-tetON back skin at 4 wk of inducible c-fos expression (n = 3). Mean ± SD. (E) MMP10 immunohistochemical analyses of the back skin of control and c-FosEp-tetON mice after 2 and 4 wk of inducible c-fos expression (n = 3). (F) S100a7a15 immunofluorescence analyses in the back skin of control and c-FosEp-tetON mice after 4 wk of inducible c-fos expression (n = 3). (G) ChIP of c-Fos at the mmp10 promoter. (Left, top) Scheme of the TRE element at the mmp10 promoter where c-Fos binds. (Right) Endpoint qPCR fragments are shown together with the representation of the percentage of binding of c-Fos to mmp10 promoter. (Left, bottom) Chromatin was immunoprecipitated using c-Fos antibody from c-FostetON keratinocytes treated ±Dox for 24 h. (H) ChIP of c-Fos at the s100a7a15 promoter. (Left, top) Scheme of the TRE element at the mmp10 promoter where c-Fos binds. (Right) Endpoint qPCR-fragments are shown together with the representation of the percentage of binding of c-Fos to s100a7a15 promoters. (Left, bottom) Chromatin was immunoprecipitated using c-Fos antibody from c-FostetON keratinocytes treated ±Dox for 24 h.
Figure 4.
Figure 4.
Blocking MMP10 signaling suppresses c-Fos-mediated epidermal hyperplasia. (A, left) Immunohistochemical analyses depicting H&E staining of c-FosEp-tetON mice [Col-Fos (+/KI); K5rtTA (+/T)] treated with vehicle or TAPI-1 (10 mg/kg, three times per week for 4 wk; n = 3 or 3). (Right panel) Epidermal thickness IHC quantification. Mean ± SD. (B, left) Immunohistochemical analyses depicting Ki67 stainings of the back skin of c-FosEp-tetON mice [Col-Fos (+/KI); K5rtTA (+/T)] treated with vehicle or TAPI-1 (10 mg/kg, three times per week for 4 wk), (n = 3 or 3). (Right panel) Ki67-positive nucleus IHC quantification. Mean ± SD. (C) MMP10 activity assay of the back skin of vehicle- and TAPI-treated control and c-FosEp-tetON mice.
Figure 5.
Figure 5.
c-Fos expression accelerates DMBA-induced papilloma and SCC development. (A) Scheme of the experimental design: Six-week-old (6w) mice were given a topical single dose of DMBA (0.5% [w/v] in acetone), and Dox was supplied 1 wk later (1w) in the water at a concentration of 0.25 g/L. (B) Representative picture of control (littermate) and c-FosEp-tetON (n = 10). (C) Quantification of the papilloma number after 8 wk of inducible c-fos expression. (D) Tumor size in c-FosEp-tetON female and male mice after DMBA and 8 and 11 wk of inducible c-fos expression. Mean ± SEM. (E) mRNA expression analyses of c-fos, mmp10, and s100a7a15 in control back skin and c-FosEp-tetON SCCs. (F) Scheme of the experimental design: Six-week-old mice were given a topical single dose of DMBA (0.5% [w/v]), and Dox was supplied 1 wk later (7w) in the food pellets. Sulindac was supplied in the drinking water at a concentration of 180 mg/L. (G, top panels) Representative pictures of DMBA-treated c-FosEp-tetON mice ± sulindac treatment after 7 wk of inducible c-fos expression. (Bottom)Immunohistochemical analyses depicting H&E and cleaved caspase 3 (cl.caspase 3) immunostaining of the back skin of DMBA-treated c-FosEp-tetON mice ± sulindac treatment after 7 wk of inducible c-fos expression. (H) Lesion number quantified when the mice were sacrificed, comparing controls and c-FosEp-tetON mice treated with DMBA ± sulindac. (I) Lesion size quantified when the mice were sacrificed, comparing controls and c-FosEp-tetON mice treated with DMBA ± sulindac. (J) Schematic representation of changes in the epidermis upon induction of c-Fos, leading to increased MMP10 and S100a7a15 and, subsequently, the recruitment of CD4 T cells. As a consequence, paracrine cytokine signaling (IL-22) promotes keratinocyte proliferation and survival, leading to epidermal hyperplasia and, when combined with DMBA, SCC development.
Figure 6.
Figure 6.
Correlating c-FOS levels and MMP10 and S100A15 in SCCs but not in BCCs or perilesional healthy skin. (A, top) c-FOS immunostainings on human “perilesional” skin (n = 20), BCCs (n = 85), and SCCs (n = 46). (Middle) MMP10 immunostainings on human “perilesional” skin (n = 20), BCCs (n = 85), and SCCs (n = 42). (Bottom) CD4 immunostainings on human “perilesional” skin (n = 20), BCCs (n = 85), and SCCs (n = 42). (Below) Correlation of c-FOS and MMP10 expression levels on human SCC immunostainings. (B) S100A15 immunostainings on human healthy skin (n = 20), BCCs (n = 85), and SCCs (n = 66).

References

    1. Aikawa Y, Morimoto K, Yamamoto T, Chaki H, Hashiramoto A, Narita H, Hirono S, Shiozawa S 2008. Treatment of arthritis with a selective inhibitor of c-Fos/activator protein-1. Nat Biotechnol 26: 817–823 - PubMed
    1. Alowami S, Qing G, Emberley E, Snell L, Watson PH 2003. Psoriasin (S100A7) expression is altered during skin tumorigenesis. BMC Dermatol 3: 1. - PMC - PubMed
    1. Baldursson B, Sigurgeirsson B, Lindelof B 1993. Leg ulcers and squamous cell carcinoma. An epidemiological study and a review of the literature. Acta Derm Venereol 73: 171–174 - PubMed
    1. Barksby HE, Milner JM, Patterson AM, Peake NJ, Hui W, Robson T, Lakey R, Middleton J, Cawston TE, Richards CD, et al. 2006. Matrix metalloproteinase 10 promotion of collagenolysis via procollagenase activation: Implications for cartilage degradation in arthritis. Arthritis Rheum 54: 3244–3253 - PubMed
    1. Boniface K, Bernard FX, Garcia M, Gurney AL, Lecron JC, Morel F 2005. IL-22 inhibits epidermal differentiation and induces proinflammatory gene expression and migration of human keratinocytes. J Immunol 174: 3695–3702 - PubMed

Publication types

MeSH terms

Substances