. 2013 Dec;19(13):2867-77.
doi: 10.1097/MIB.0b013e3182a82ae9.

Chloride channel ClC-2 is a key factor in the development of DSS-induced murine colitis

Affiliations

Chloride channel ClC-2 is a key factor in the development of DSS-induced murine colitis

Prashant Nighot et al. Inflamm Bowel Dis. 2013 Dec.

Abstract

Background: Previously, it was shown that the chloride channel ClC-2 modulates intestinal tight junction (TJ) barrier function. The aim of the present study was to investigate the role of ClC-2 in epithelial barrier function and recovery in the event of epithelial injury.

Methods: The role of ClC-2 was investigated in TJ barrier function in dextran sodium sulfate (DSS)-induced colitis in ClC-2 knockout mice and ClC-2 knockdown intestinal Caco-2 cells. Barrier function was measured electrophysiologically and by transepithelial mannitol fluxes. Selected TJ and associated proteins were Western blotted, cytokines were measured using quantitative PCR, and human colonic biopsies were examined with immunohistochemistry.

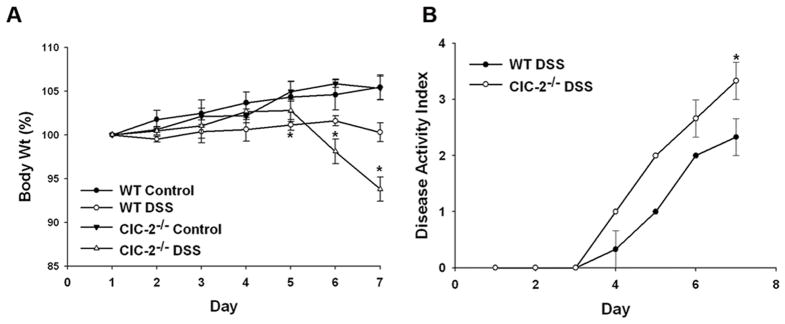
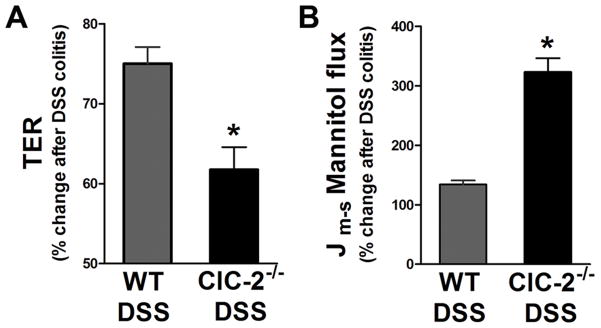
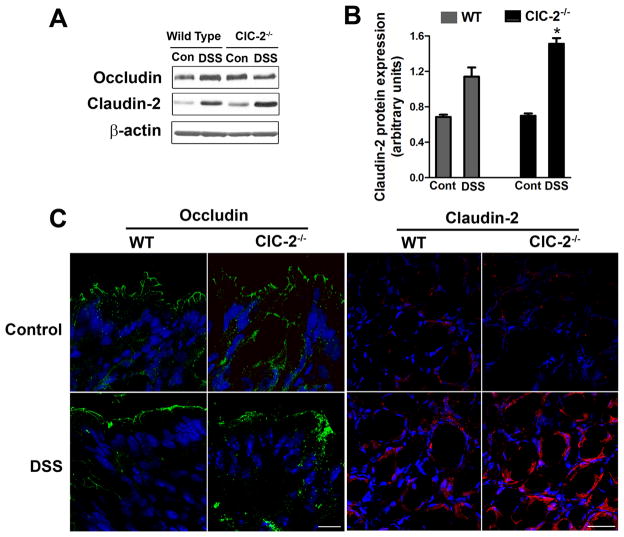
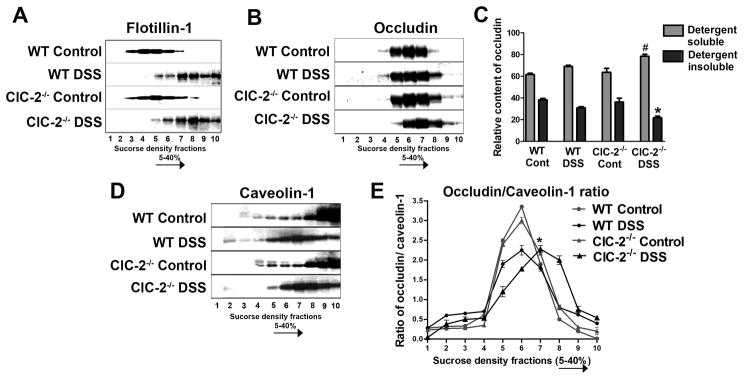
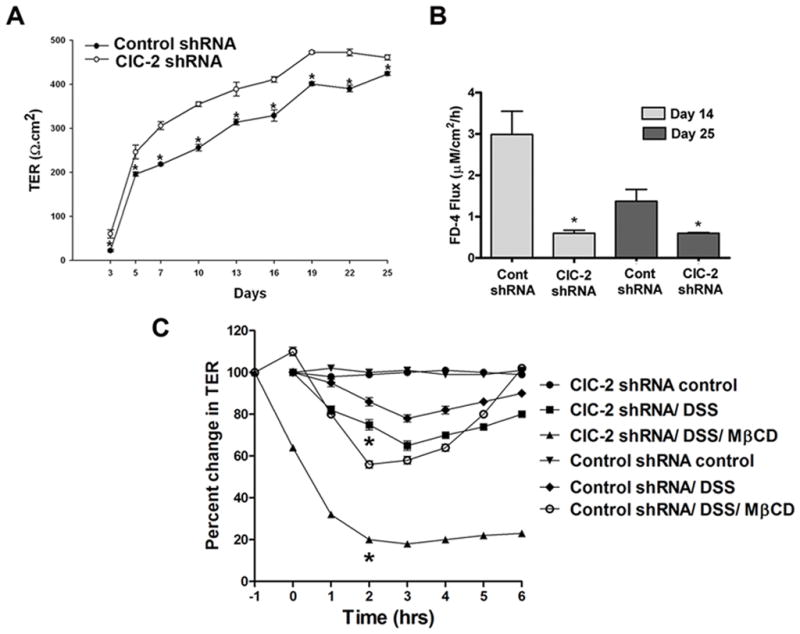
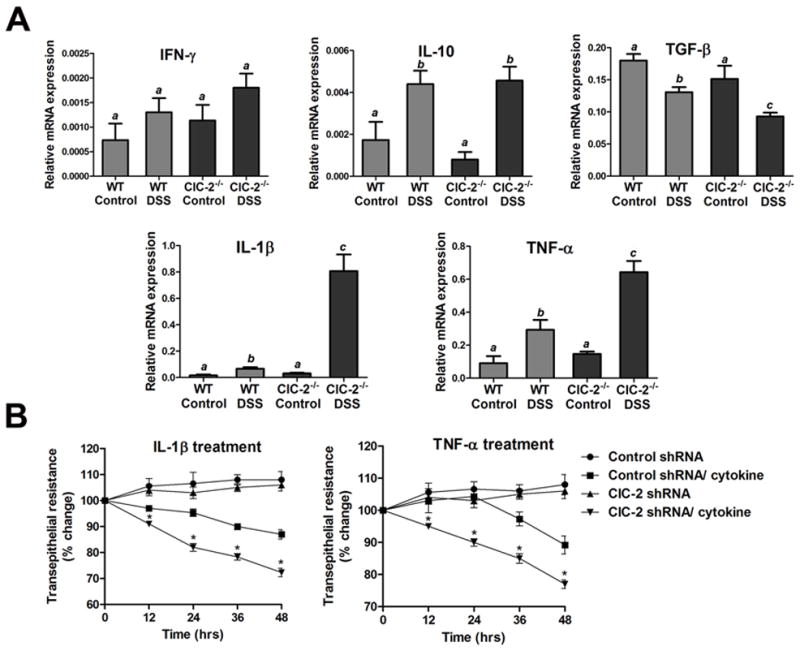
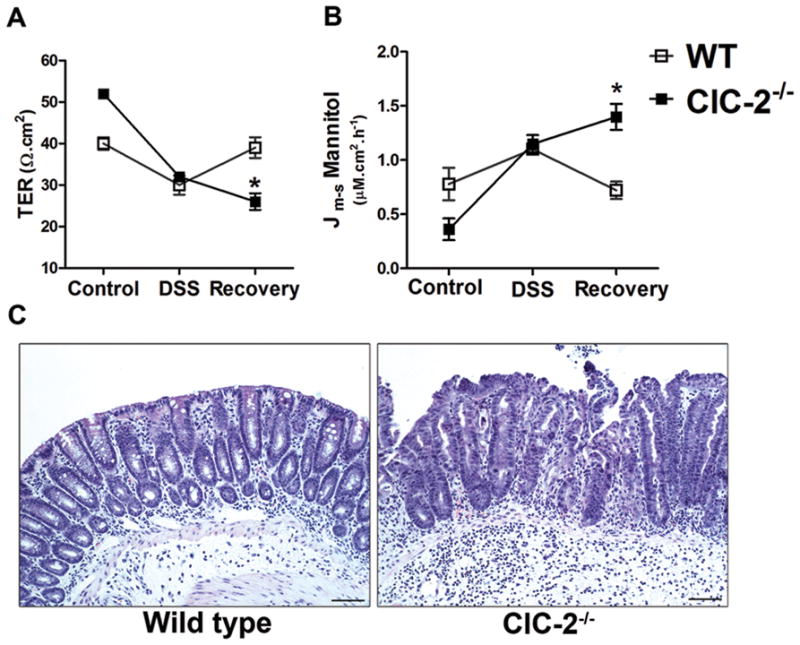
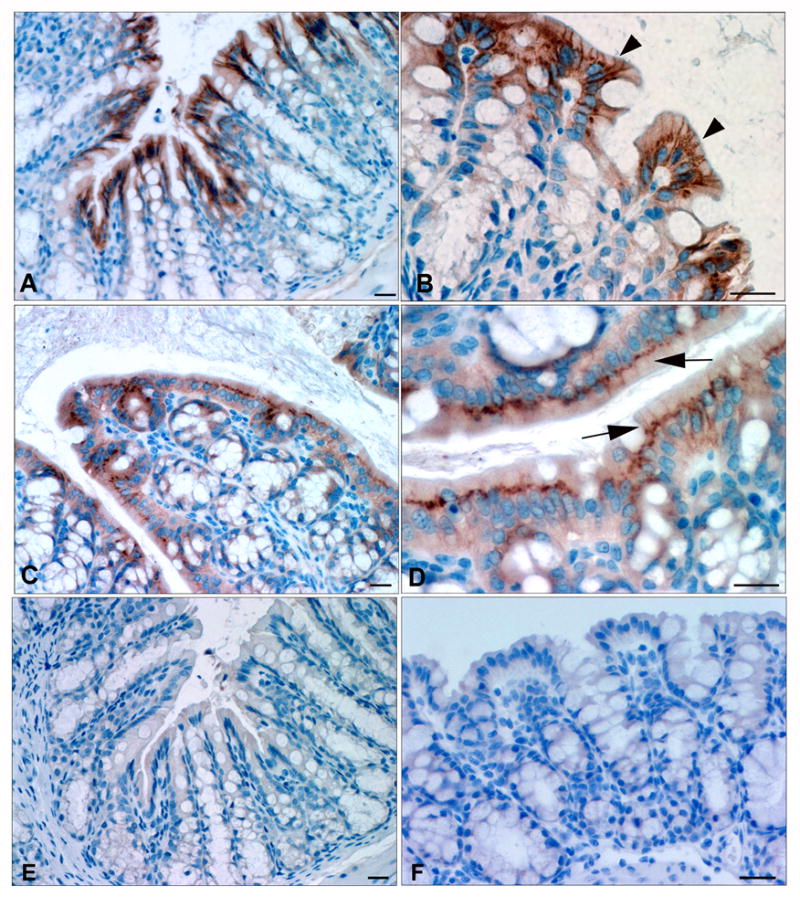
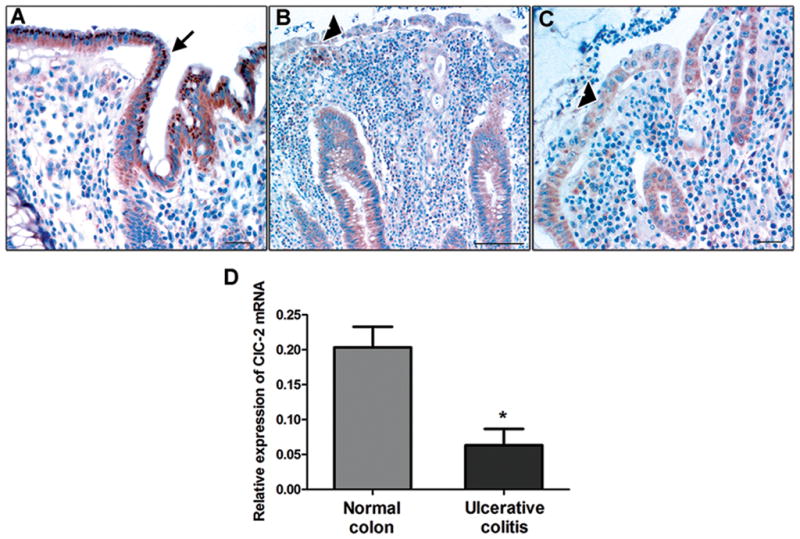
Results: ClC-2 mice had a higher disease activity index, higher histological scores, and increased paracellular permeability compared with wild-type mice when treated with DSS. DSS-treated ClC-2 mice had increased claudin-2 expression, greater loss of occludin in the membrane, increased association of occludin with caveolin-1, and significantly increased tumor necrosis factor-α and interleukin-1β messenger RNA. ClC-2 knockdown in human intestinal Caco-2 cells resulted in a greater loss of epithelial resistance in the event of epithelial injury. The restoration of colonic barrier function after DSS colitis was delayed in ClC-2 mice. In human colonic biopsies, the protein and messenger RNA expression of ClC-2 was found to be reduced in patients with ulcerative colitis.

Conclusions: ClC-2 plays a critical role in experimental colitis in that its absence increases disease activity, reduces barrier function and recovery, and perturbs TJs. Furthermore, ClC-2 expression is markedly reduced in the colon of human patients with ulcerative colitis.


Conflict of interest statement

Conflicts of interest: The authors disclose no conflicts.

Figures

Figure 1
Figure 1
Severity of DSS colitis in ClC-2−/− mice. The loss of body weight (A) and disease activity index (B) during 6 days of DSS treatment were significantly higher in ClC-2−/− mice compared to wild type ClC-2+/+ mice (*p < 0.01). The data is representative of more than 3 independent experiemnts (n=3 for each group, in each experiment).
Figure 2
Figure 2
Histological changes in DSS colitis. Histological examination revealed marked neutrophilic and mononuclear infiltration in the lamina propria, the presence of inflammatory polyps, disappearance of crypts, and edema in the muscularis in ClC-2−/− DSS colon (histological score: 2 ± 0.28 and 3.33 ± 0.33 for WT and ClC-2−/− mice, respectively (on a scale of 0–4, p < 0.01) (black bars = 50μM).
Figure 3
Figure 3
Epithelial permeability in DSS colitis. A: In Ussing chambers experiments, the percent reduction in the TER from control colon was significantly higher in ClC-2−/− mice than WT mice (*p < 0.05). B: After DSS treatment, the mucosal-to-serosal paracellular flux of mannitol showed 3-fold increases in the colon of ClC-2−/− mice compared to that of WT mice (*p < 0.01).
Figure 4
Figure 4
TJ analyses in DSS colitis. A: Western analysis showed increased total expression of claudin-2 protein in the DSS colon of ClC-2−/− mice. B: Densitometry analysis demonstrates a significant increase in total expression of claudin-2 in DSS colon of ClC-2−/− mice (*, different from all other groups, p < 0.05). C: In confocal immunofluorescence, the occludin (green) staining on surface epithelium was diffuse and subapically distributed in the colon of ClC-2−/− DSS mice compared to the colon of WT DSS mice. The staining of claudin-2 (red) was found to be increased in colonic crypts after DSS administration. The DSS-induced increase in the intensity of claudin-2 staining was higher in ClC-2−/− DSS mice compared to WT DSS mice. White bar = 50μM.
Figure 5
Figure 5
A. Sucrose density gradient based fractions were prepared, as detailed in methods, and were probed for flotillin-1 as a marker for lipid rafts. The majority of flotilin-1 protein was present in low density fractions in control WT and ClC-2−/− mouse colon (fractions 2–5). In DSS colitis, flotillin-1 protein content was shifted to high density detergent soluble fractions (fractions 6–10). B. In sucrose density gradient based fractionation studies, expression of occludin protein showed a significant shift from detergent insoluble fractions to detergent soluble fractions in DSS-treated ClC-2−/− colon when compared to DSS-treated WT colon. C: The relative content of occludin in low density detergent insoluble (fractions 2–5) and high density detergent soluble (fractions 6–10) fractions was calculated by densitometry. #, *, p<0.05 vs. respective WT DSS. D: In similar sucrose density gradient studies, the presence of caveolin-1 within high density sucrose fractions in control WT and ClC-2−/− colon was found to be shifted to medium density sucrose fractions after induction of DSS colitis. E: The densitometric values of occludin and caveolin-1, obtained from sucrose density fractions as in B and D, were used to calculate the ratio of occludin/caveolin-1 contents in respective sucrose fractions. In control WT and ClC-2−/− colon, the occludin/caveolin-1 ratio showed a peak in the middle sucrose density fractions. Alternatively, the peak occludin/caveolin-1 ratio in DSS treated ClC-2−/− was displaced toward high density, detergent soluble fractions, indicating higher content of occludin in association with caveolin-1 in these fractions (*, different from respective fraction of WT DSS group, p< 0.01, representation of n=6).
Figure 6
Figure 6
Barrier function in ClC-2 knockdown Caco-2 cells. A: The baseline TER in Caco-2 ClC-2 shRNA cells was significantly higher than control shRNA cells (representative of n = 6, multiple independent sets of observations, *p < 0.01). B: Consistent with increased TER measurements, ClC-2 shRNA cells had reduced paracellular permeability to dextran (4kD) as measured on day 14 and day 25 after plating (*, different from control shRNA at respective time points, p < 0.01, n=6). C: In spite of having reduced baseline permeability, ClC-2 shRNA Caco-2 cells, when treated with 2% DSS, showed significantly higher loss of the TER compared to control shRNA cells (*p < 0.01 vs. control shRNA DSS). Disruption of caveolae with methyl-beta-cyclodextrin (MβCD) aggravated the DSS-induced loss of TER. In ClC-2 shRNA cells, DSS treatment in the presence of MβCD led to profound and acute loss of TER, as compared to control shRNA cells. MβCD was added to the media 1 hour before treatment with DSS and MβCD media was replaced after two hours of treatment. After replacement of MβCD, the TER was found to have recovered in control but not ClC-2 shRNA cells. (*, p<0.01 vs. control shRNA/DSS/MβCD, n=6).
Figure 7
Figure 7
Inflammatory cytokines in DSS-induced colitis and loss of TJ barrier function. A: The qPCR analysis of DSS colitis tissue showed decreased mRNA expression of TGF-β and markedly increased expression of mRNA of TNF-α and IL-1β in ClC-2−/− DSS colon verses WT DSS colon (a,b, and c indicates significant difference compared to WT control, p < 0.01, n=4). The mRNA expression of respective cytokines was normalized to mRNA expression of GAPDH. B: Treatment of Caco-2 cells with IL-1β and TNF-α (both 10ng/ml) reduced the TER over a period of 48 hours. The reduction in the TER with either IL-1β or TNF-α was significantly higher in ClC-2 shRNA cells compared to control scrambled shRNA cells (*p < 0.01 vs. control shRNA, n=6).
Figure 8
Figure 8
The role of ClC-2 in post-DSS barrier recovery. After 6 days of DSS treatment, the DSS was withdrawn for 48 hours after which the colonic tissues were harvested and mounted on Ussing chambers. A: WT mice showed significant recovery of TER, whereas ClC-2−/− mice showed continued loss of TER (*p < 0.01 vs. WT). B: Consistent with the lack of recovery of TER, mannitol permeability in ClC-2−/− colon remained significantly increased for 48 hours following removal of DSS (*p < 0.01 vs. WT). C: In histological examination, WT mice revealed re epithelization with minimal presence of inflammatory cells and oedema in the lamina propria of the colon. In ClC-2−/− mice, abnormally proliferating crypts, crypt abscesses, and persistence of inflammatory cells and oedema in the submucosal was seen. Bar = 25 μM.
Figure 9
Figure 9
Immunohistochemical examination of murine colon. ClC-2 staining (brown color) was present at the apical lateral membrane and supranuclear cytoplasmic location in the surface epithelium (A & B, arrowheads). No staining was detected in the crypts. In DSS colitis tissues, ClC-2 staining on the lateral membranes was weak and prominent cytoplasmic aggregations were common (C & D, arrows). The negative control slides (E: WT mice colon without primary antibody; F: ClC-2−/− mice colon) did not reveal any staining. Bar = 25μM.
Figure 10
Figure 10
Immunohistochemistry and qPCR for ClC-2 in ulcerative colitis biopsies. A: In unaffected colonic tissue, ample ClC-2 staining was present (brown color, arrow). However, in UC patients, expression of ClC-2 in the colonic surface epithelium was found to be markedly reduced (B and C, arrowhead). Bar = 25μM. The images are representative of 6 normal and 6 UC biopsies. D: In the qPCR analysis, mRNA expression of ClC-2 was found to be significantly reduced in UC colonic biopsies compared to control patients. The ClC-2 mRNA expression is normalized to mRNA expression of GAPDH. (n = 3 in each group, *p < 0.05).

References

    1. Nilius B, Droogmans G. Amazing chloride channels: an overview. Acta Physiol Scand. 2003;177:119–147. - PubMed
    1. Jentsch TJ. CLC chloride channels and transporters: from genes to protein structure, pathology and physiology. Crit Rev Biochem Mol Biol. 2008;43:3–36. - PubMed
    1. Niemeyer MI, Yusef YR, Cornejo I, et al. Functional evaluation of human ClC-2 chloride channel mutations associated with idiopathic generalized epilepsies. Physiol Genomics. 2004;19:74–83. - PubMed
    1. Bosl MR, Stein V, Hubner C, et al. Male germ cells and photoreceptors, both dependent on close cell-cell interactions, degenerate upon ClC-2 Cl(−) channel disruption. EMBO J. 2001;20:1289–1299. - PMC - PubMed
    1. Catalan MA, Flores CA, Gonzalez-Begne M, et al. Severe Defects in Absorptive Ion Transport in Distal Colons of Mice That Lack ClC-2 Channels. Gastroenterology. 2011 - PMC - PubMed

Publication types

MeSH terms

LinkOut - more resources