. 2013 Nov 1;288(44):31592-601.
doi: 10.1074/jbc.M113.503300. Epub 2013 Sep 12.

Mutagenic analysis of the intracellular portals of the human 5-HT3A receptor

Affiliations

Mutagenic analysis of the intracellular portals of the human 5-HT3A receptor

Jane E Carland et al. J Biol Chem. .

Abstract

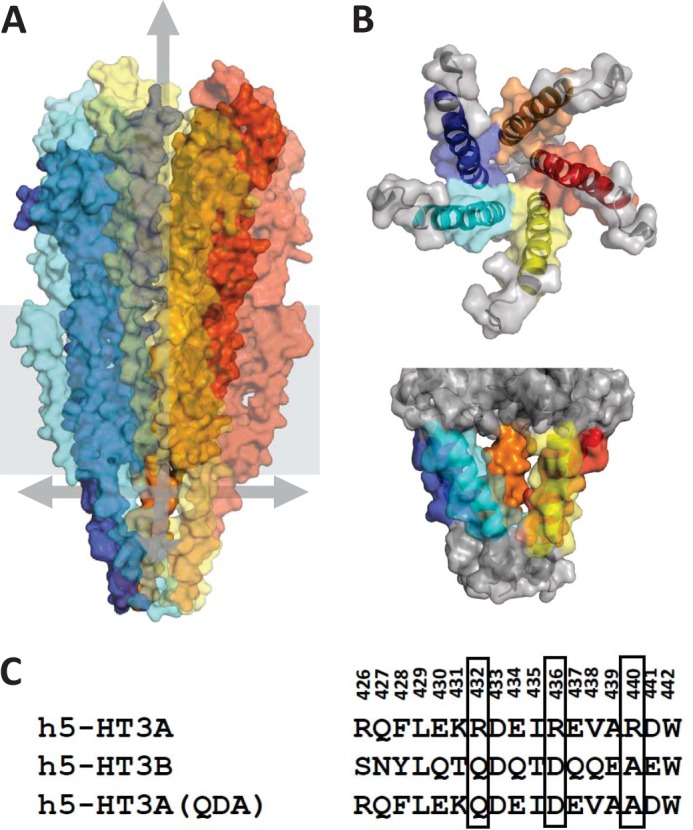
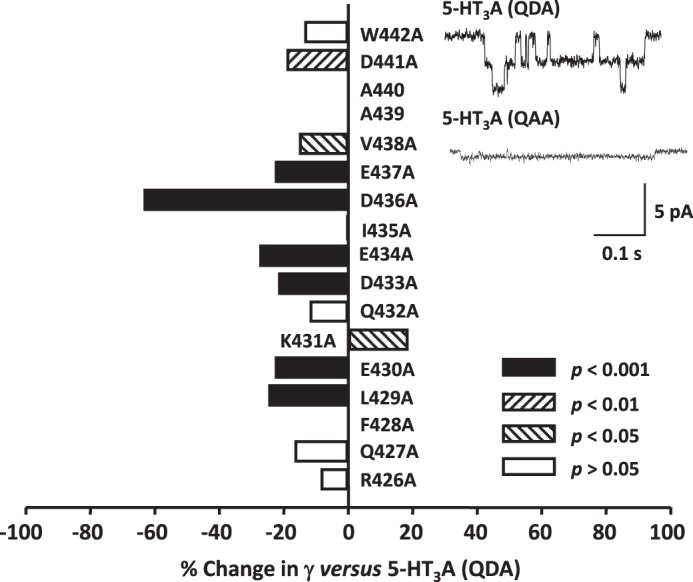
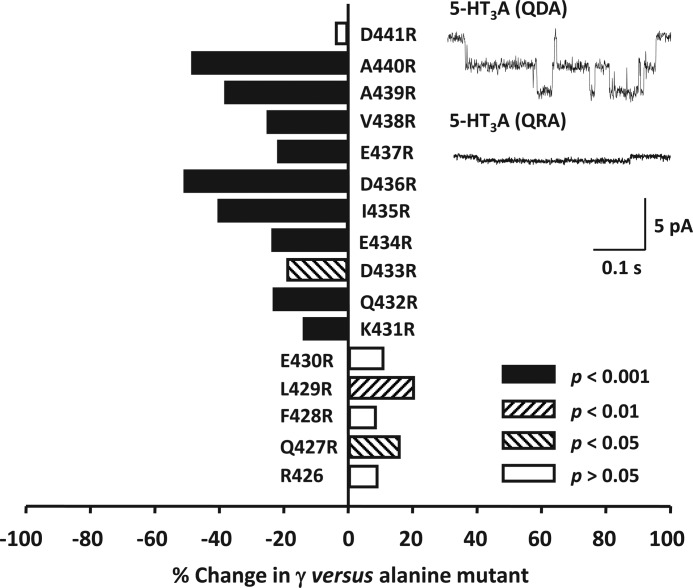
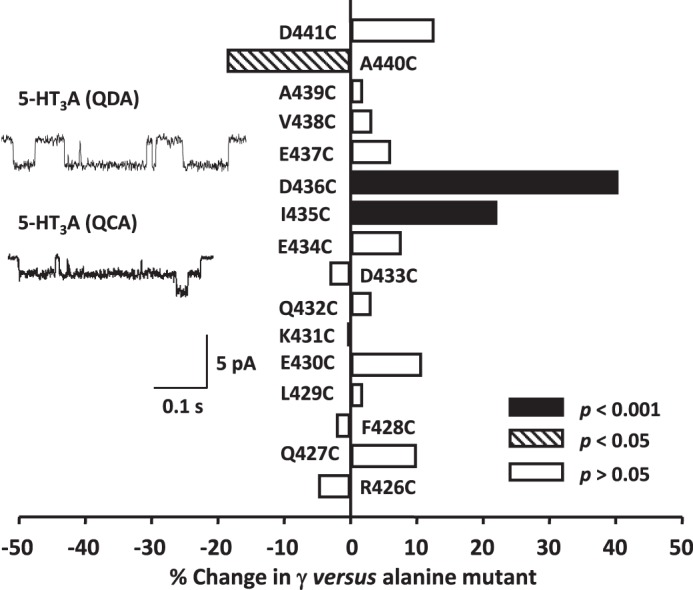
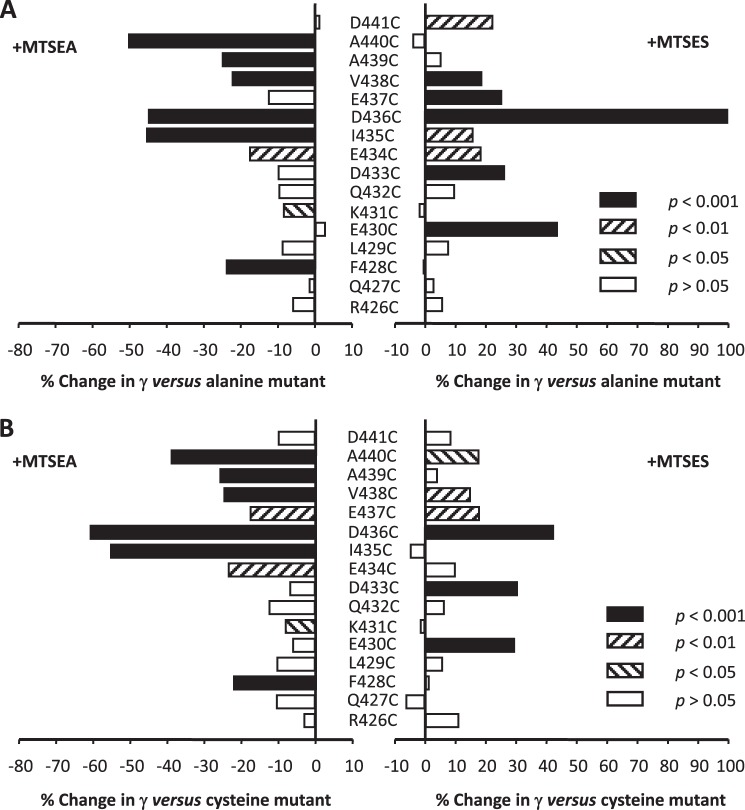
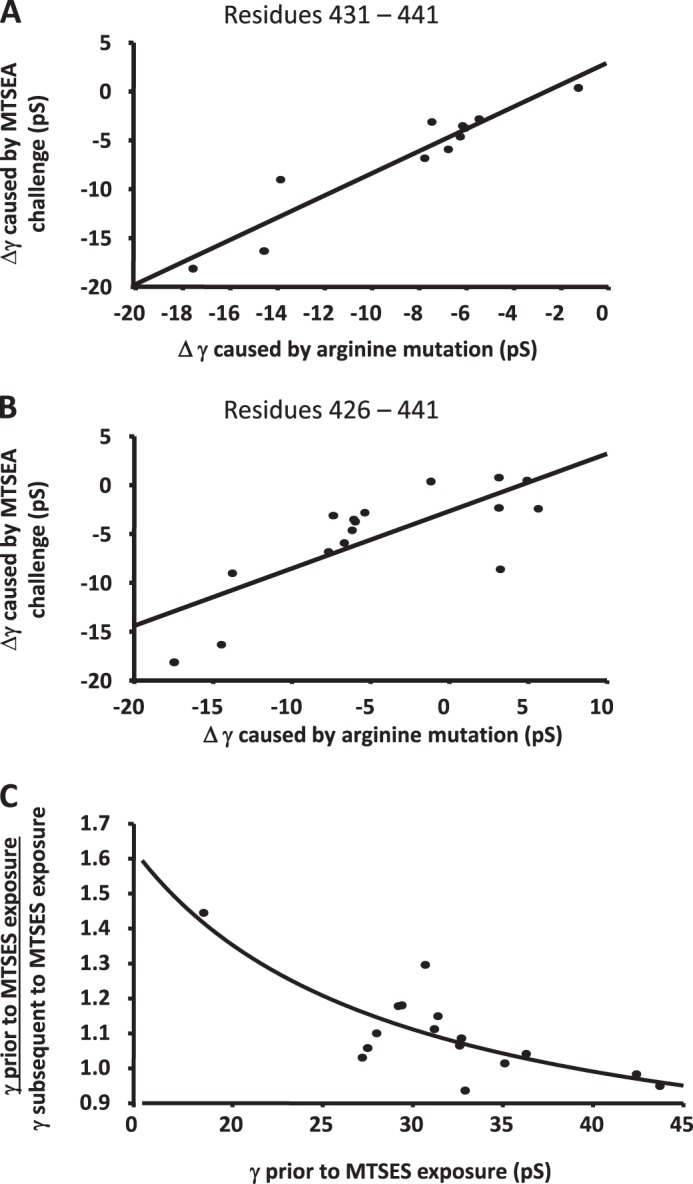
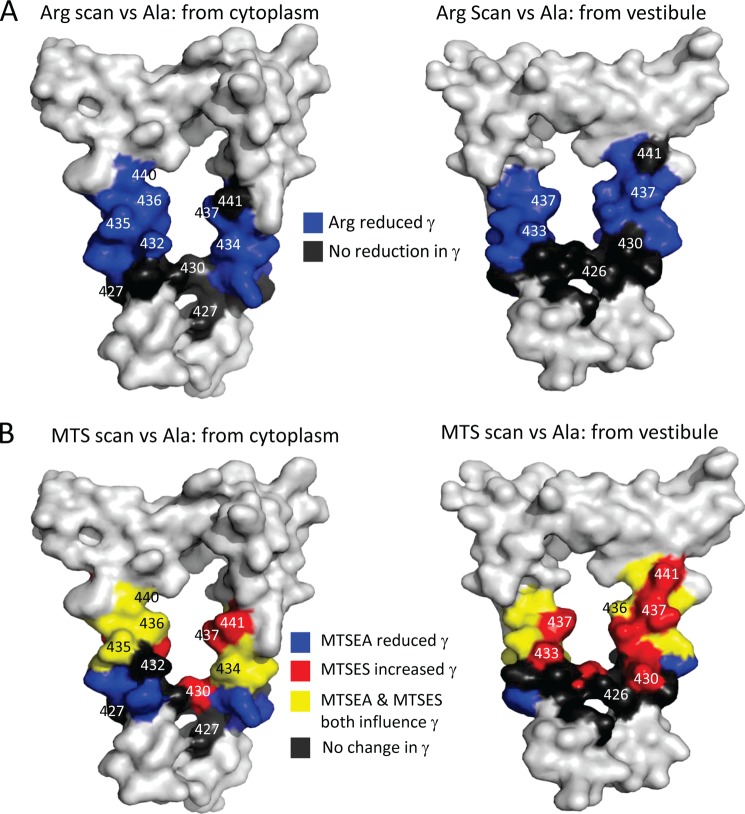
Structural models of Cys-loop receptors based on homology with the Torpedo marmorata nicotinic acetylcholine receptor infer the existence of cytoplasmic portals within the conduction pathway framed by helical amphipathic regions (termed membrane-associated (MA) helices) of adjacent intracellular M3-M4 loops. Consistent with these models, two arginine residues (Arg(436) and Arg(440)) within the MA helix of 5-hydroxytryptamine type 3A (5-HT3A) receptors act singularly as rate-limiting determinants of single-channel conductance (γ). However, there is little conservation in primary amino acid sequences across the cytoplasmic loops of Cys-loop receptors, limiting confidence in the fidelity of this particular aspect of the 5-HT3A receptor model. We probed the majority of residues within the MA helix of the human 5-HT3A subunit using alanine- and arginine-scanning mutagenesis and the substituted cysteine accessibility method to determine their relative influences upon γ. Numerous residues, prominently those at the 435, 436, 439, and 440 positions, were found to markedly influence γ. This approach yielded a functional map of the 5-HT3A receptor portals, which agrees well with the homology model.

Keywords: Cys-loop Receptors; Neurotransmitter Receptors; Nicotinic Acetylcholine Receptors; Patch Clamp Electrophysiology; Pentameric Ligand-gated Ion Channel; Serotonin.


Figures

FIGURE 1.
FIGURE 1.
The putative structure of the 5-HT3 receptor ion conduction pathway. A, the complete homology model of the 5-HT3A receptor based on the Torpedo nACh receptor structure. The pentameric protein is surface-rendered with foreground subunits made transparent. Arrows highlight the putative conduction pathway, one pointing to the outer vestibule, the others pointing out three of the five cytoplasmic portals. B, five 5-HT3A(QDA) receptor MA helices viewed from above (top panel) and from the cytoplasm (bottom panel). These structures are depicted with both transparent surface rendering and ribbons. The residues substituted by mutagenesis in the current study are indicated in color. Differing colors were used to distinguish each of the five subunits. C, the amino acid numbering is that of the human 5-HT3A subunit (h5-HT3A). The arginine residues that are collectively responsible for the sub-picosiemen single-channel conductance of the human 5-HT3A receptor are boxed together with the homologous residues within the 5-HT3B subunit sequence.
FIGURE 2.
FIGURE 2.
The influence of alanine substitutions upon the single-channel conductance (γ) of the 5-HT3A(QDA) receptor. The bar graph summarizes the effect of individual replacement of residues 426–438 and 441 and 442 of the 5-HT3A(QDA) subunit by alanine. Note that alanine is already present at the 438 and 439 loci of the 5-HT3A(QDA) subunit. Data are reported as the mean percentage change in γ caused by each mutation, with the 5-HT3A(QDA) receptor acting as control. The mean reference 5-HT3A(QDA) receptor γ value was 35.9 pS (Table 1). Statistical analysis was performed by comparing the raw values of γ for the 5-HT3A(QDA) and mutant receptor constructs. The inset traces are single-channel events recorded from excised outside-out patches expressing either (top) 5-HT3A(QDA) receptors (control) or (bottom) 5-HT3A(QAA) receptors (named D436A in the graph).
FIGURE 3.
FIGURE 3.
The influence of arginine substitutions upon the single-channel conductance (γ) of the 5-HT3A(QDA) receptor. The bar graph summarizes the effect of individual replacement of residues 427–441 of the 5-HT3A(QDA) subunit by arginine. Note that arginine is already present at the 426 locus of the 5-HT3A(QDA) subunit. Data are reported as the mean percentage change in γ caused by each mutation, with the appropriate alanine substituted 5-HT3A(QDA) receptor construct acting as the reference. Statistical analysis was performed by comparing the raw values of γ for the arginine- and alanine-substituted 5-HT3A(QDA) receptor constructs. The inset traces are single-channel events recorded from excised outside-out patches expressing either (top) 5-HT3A(QDA) receptors (control) or (bottom) 5-HT3A(QRA) receptors (named D436R in the graph).
FIGURE 4.
FIGURE 4.
The influence of cysteine substitutions upon the single-channel conductance (γ) of the 5-HT3A(QDA) receptor. The bar graph summarizes the effect of individual replacement of residues 426–441 of the 5-HT3A(QDA) subunit by cysteine. Data are reported as the mean percentage change in γ caused by each mutation, with the appropriate alanine substituted 5-HT3A(QDA) receptor construct acting as control. Statistical analysis was performed by comparing the raw values of γ for the cysteine- and alanine-substituted 5-HT3A(QDA) receptor constructs. The inset traces are single-channel events recorded from excised outside-out patches expressing either (top) 5-HT3A(QDA) receptors (control) or (bottom) 5-HT3A(QCA) receptors (named D436C in the graph).
FIGURE 5.
FIGURE 5.
The influence of modification of engineered cysteine substitutions by MTS reagents upon the single-channel conductance (γ) of the 5-HT3A(QDA) receptor. The bar graphs in A and B summarize the effect of challenge by either positively charged MTSEA or negatively charged MTSES on the γ the 5-HT3A(QDA) receptor in which residues 426–441 had been individually replaced by cysteine. Note that the overall trend is for MTSEA to reduce and MTSES to enhance γ. Data are reported as the mean percentage change in γ caused by the MTS reagents. In A and B, the appropriate alanine- or cysteine-substituted 5-HT3A(QDA) receptor constructs, respectively, serve as the reference. Statistical analysis was performed by comparing the raw values of γ.
FIGURE 6.
FIGURE 6.
The influences of arginine substitution and modification of engineered cysteine substitution by MTS reagents upon the single-channel conductance (γ) of the 5-HT3A(QDA) receptor. A, plot depicting the strong correlation (r2 = 0.89) between the change in γ produced by arginine substitution and by the reaction of substituted cysteine residues by positively charged MTSEA at residues 431–441, inclusive, both compared with alanine. B, inclusion of residues 426–430 at which the presence of arginine was associated with an increase in conductance versus alanine controls weakens the correlation (r2 = 0.58). C, correlation (r2 = 0.68) between the magnitude of the increase in γ produced by challenge with MTSES versus the γ of the construct without exposure to the MTS reagent.
FIGURE 7.
FIGURE 7.
Residues that determine single-channel conductance (γ) mapped onto a model of a 5-HT3A receptor cytoplasmic portal. A, surface renderings of an homology model of a 5-HT3A receptor portal formed by adjacent MA helices, viewed from the cytoplasm (left panel) or from within the inner vestibule (right panel). When arginine residues were present at the positions rendered in blue, 5-HT3A receptors exhibited significantly reduced γ values when compared with their alanine equivalents (Fig. 3). When arginine residues were present at the positions rendered in black, the γ values of 5-HT3A receptors were either unchanged or slightly elevated when compared with their alanine equivalents. B, the same surface renderings of MA stretches represented in A, colored according to the effect of the MTS reagents, MTSEA and MTSES, on 5-HT3A receptors into which cysteine residues were substituted at the positions indicated. Cysteine substituents rendered in yellow were associated with significantly decreased and increased γ upon MTSEA and MTSES treatment, respectively, when compared with their alanine equivalents (Fig. 5A). Those indicated in blue or red only exhibited a decrease by MTSEA or an increase by MTSES, respectively, when compared with their alanine equivalents. Cysteine substituents rendered in black were unaffected by both MTSEA and MTSES when compared with their alanine equivalents. The 5-HT3A receptor was modeled on the T. marmorata structure (see “Experimental Procedures”).

References

    1. Millar N. S., Gotti C. (2009) Diversity of vertebrate nicotinic acetylcholine receptors. Neuropharmacology 56, 237–246 - PubMed
    1. Changeux J. P. (2012) The nicotinic acetylcholine receptor: the founding father of the pentameric ligand-gated ion channel superfamily. J. Biol. Chem. 287, 40207–40215 - PMC - PubMed
    1. Barnes N. M., Hales T. G., Lummis S. C. R., Peters J. A. (2009) The 5HT3 receptor – the relationship between structure and function. Neuropharmacology 56, 273–284 - PMC - PubMed
    1. Lummis S. C. R. (2012) 5HT3 receptors. J. Biol. Chem. 287, 40239–40245 - PMC - PubMed
    1. Olsen R. W., Sieghart W. (2008) International Union of Pharmacology. LXX. Subtypes of γ-aminobutyric acidA receptors: classification on the basis of subunit composition, pharmacology, and function. Update. Pharmacol. Rev. 60, 243–260 - PMC - PubMed

Publication types

Substances

LinkOut - more resources