. 2014 Jul;72(1):124-36.
doi: 10.1002/mrm.24913. Epub 2013 Sep 12.

Towards elimination of the dark-rim artifact in first-pass myocardial perfusion MRI: removing Gibbs ringing effects using optimized radial imaging

Affiliations

Towards elimination of the dark-rim artifact in first-pass myocardial perfusion MRI: removing Gibbs ringing effects using optimized radial imaging

Behzad Sharif et al. Magn Reson Med. 2014 Jul.

Abstract

Purpose: Subendocardial dark-rim artifacts (DRAs) remain a major concern in first-pass perfusion (FPP) myocardial MRI and may lower the diagnostic accuracy for detection of ischemia. A major source of DRAs is the "Gibbs ringing" effect. We propose an optimized radial acquisition strategy aimed at eliminating ringing-induced DRAs in FPP.

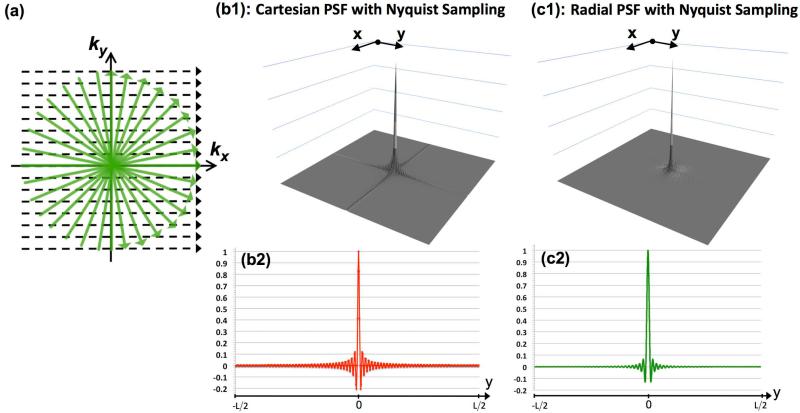
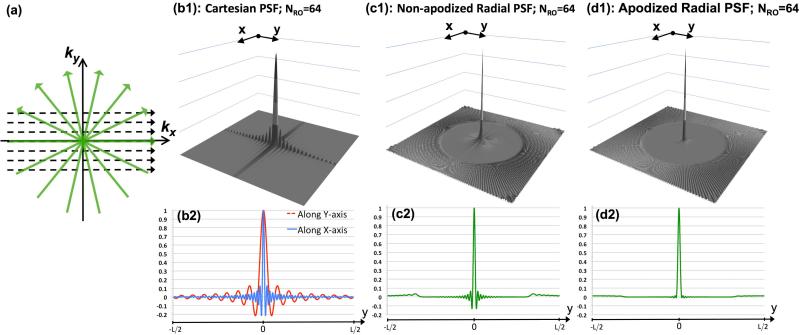
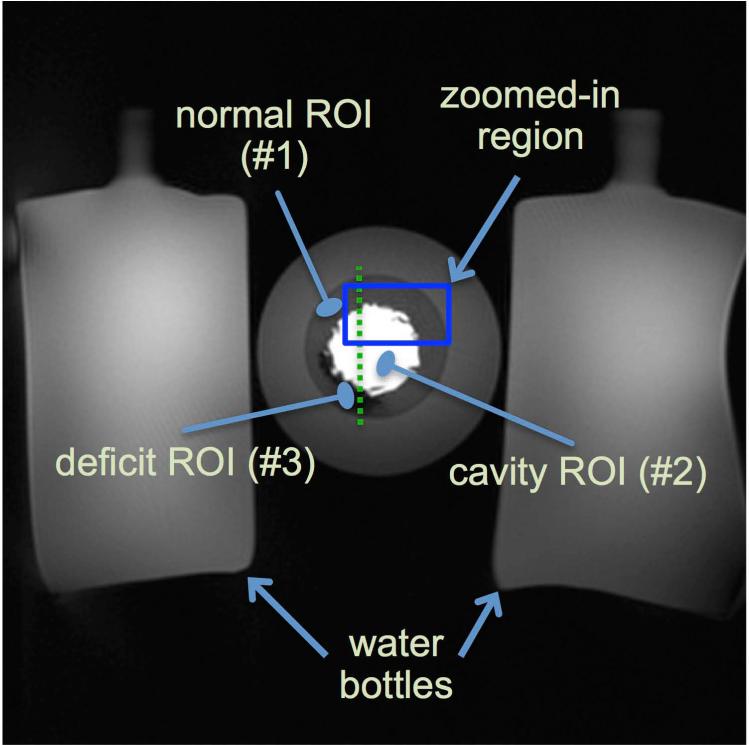
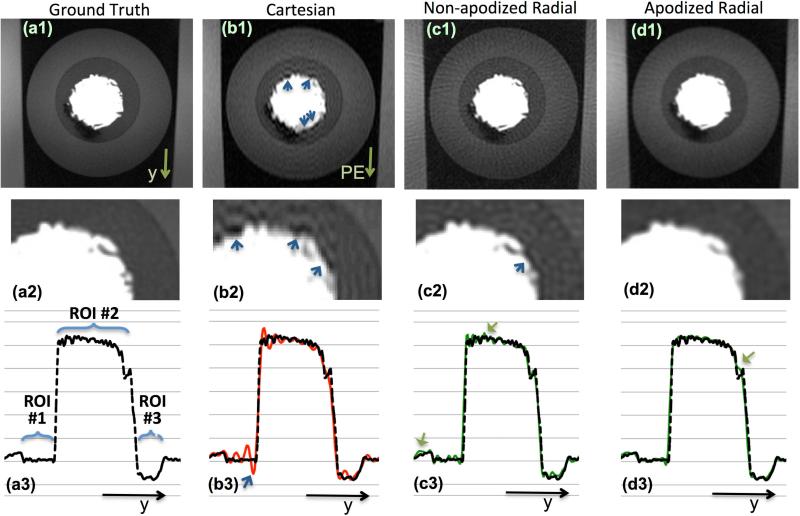
Theory and methods: By studying the underlying point spread function (PSF), we show that optimized radial sampling with a simple reconstruction method can eliminate the oscillations in the PSF that cause ringing artifacts. We conducted realistic MRI phantom experiments and in vivo studies (n = 12 healthy humans) to evaluate the artifact behavior of the proposed imaging scheme in comparison to a conventional Cartesian imaging protocol.

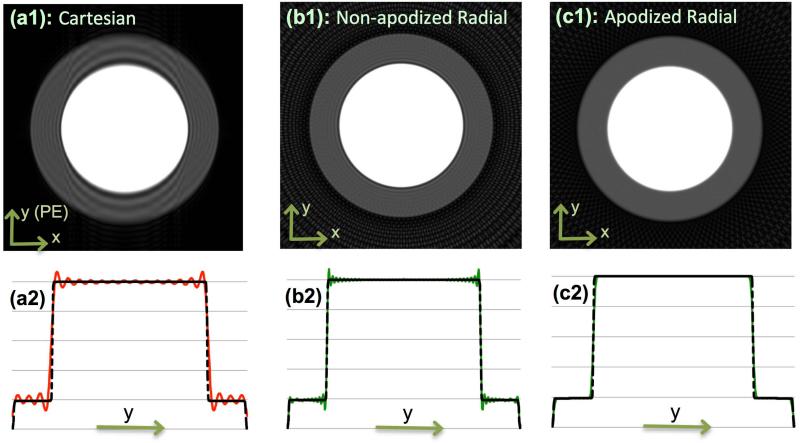
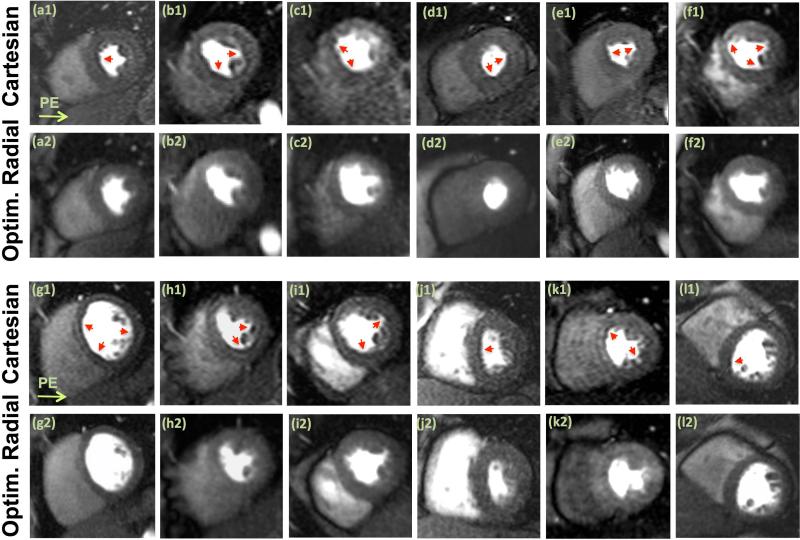
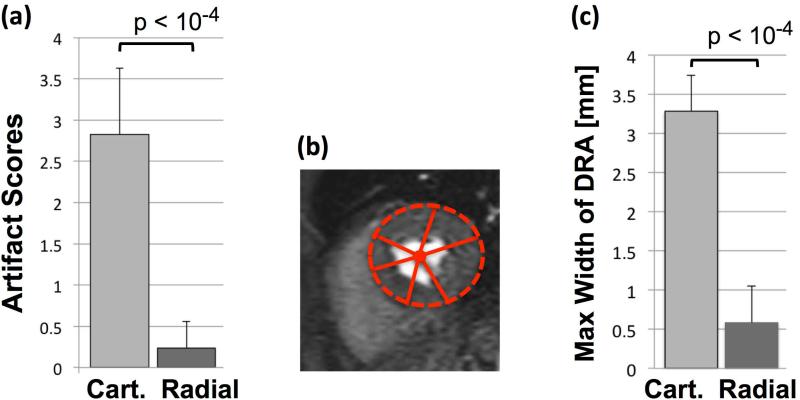
Results: Simulations and phantom experiments verified our theoretical expectations. The in vivo studies showed that optimized radial imaging is capable of significantly reducing DRAs in the early myocardial enhancement phase (during which the ringing effect is most prominent and may obscure perfusion defects) while providing similar resolution and image quality compared with conventional Cartesian imaging.

Conclusion: The developed technical framework and results demonstrate that, in comparison to conventional Cartesian techniques, optimized radial imaging with the proposed optimizations significantly reduces the prevalence and spatial extent of DRAs in FPP imaging.

Keywords: Gibbs ringing; dark-rim artifact; first-pass perfusion MRI; myocardial perfusion; radial sampling; subendocardial ischemia.


Figures

Figure 1
Figure 1
PSF analysis for the sufficiently sampled scenario: (a) Schematic for sufficiently sampled Cartesian and radial sampling patterns with the same readout resolution; Panels (b1) and (c1) show the absolute value of the PSFs for Nyquist-sampled Cartesian and radial acquisitions, respectively (with NS=256 samples per readout and a fixed FOV of [-L,L]); Panels (b2) and (c2) are 1D cuts of the respective PSFs along the y axis (same as the cut along x axis).
Figure 2
Figure 2
PSF analysis for the limited readouts scenario: (a) Schematic for the limited-readout sampling scenario for Cartesian and radial acquisition with equal number of readouts and readout resolution; Panels (b)-(d) show PSFs with NRO=64 readouts and NS=256 samples per readout (fixed readout FOV [-L,L]); (b1,b2) absolute value of the Cartesian PSF and its 1D cuts along x and y; the FOV along PE is [-0.75L,0.75L]; Panels (c1,c2) and (d1,d2) show the radial PSF and its 1D cut corresponding to non-apodized reconstruction and apodized reconstruction (apodizer as in Eq. [3] using Ω = 1.17), respectively. In contrast to radial sampling, insufficient k-space coverage along ky (PE) in Cartesian sampling results in low frequency oscillations along y (3 times wider side lobes than x), as shown in (b1,b2).
Figure 3
Figure 3
Numerical phantom results: (a1) Cartesian reconstruction of analytical disk phantom with same acquisition scheme as in Fig. 2 (3-times lower resolution along y); (b1) Non-apodized radial reconstruction (same number of readouts and readout resolution); (c1) Apodized radial reconstruction with the same k-space data as in (b1) (same apodizer as Fig. 2(d)). All images use zero-filled interpolation to 512x512 image matrix. Panels (a2), (b2), and (c2) are 1D cuts of the images in the top panel along the center of the image parallel to the y axis that are overlaid on the ground truth (dotted line). The Cartesian image in (a1) exhibits significant ringing artifacts (Gibbs) along y (PE) whereas apodized radial reconstruction in (c1) eliminates all ringing-induces artifacts and has reduced streaking compared to (b1). Specifically, the energy (2-norm) of the streak region outside of the disks as a percentage of the energy of the disk phantom is 40% lower in (c1) compared to (b1) (11.5% vs. 19%). Overall, the results verify the PSF effects described in Figs. 1-2, and demonstrate that radial sampling with wide k-space coverage and apodized reconstruction can effectively eliminate the DRAs caused by Gibbs-like ringing effects.
Figure 4
Figure 4
Description of imaged MR gelatin-Gadolinium phantom with realistic signal intensity ratios, used to demonstrate robustness of projection imaging to Gibbs ringing. This “ground truth” image is acquired at 1.0x1.0 mm2 resolution using a SR-prepared FLASH radial pulse sequence with 384 readouts (projections). The ratio of the signal intensity in the cavity (ROI #2) to the normal region (ROI #1) is approximately 6 to 1 (range: 5.5-6.1). The cavity and normal regions were composed of a mixture of gelatin, saline, and contrast whereas the deficit region (ROI #3) contained almost no contrast agent. The T1 values ROIs #1, #2, and #3, are approximately 750 ms, 60 ms, and 1200 ms, respectively (estimated based on pixel-by-pixel T1 fitting using Cartesian data acquired separately with 6 different TIs). The highlighted box is the zoomed-in region shown in Fig. 5. The dotted line shows the location of the cut for the 1D profiles shown in Fig 5.
Figure 5
Figure 5
Reconstructions results for the MR phantom in Fig. 4. The top row (a1-d1) shows zoomed-in reconstruction result; the middle row (a2-d2) shows images in the top row further zoomed-in to the box in Fig. 4; and the bottom row (a3-d3) are 1D cuts along the cut line in Fig. 4, with (a3) overlaid on (b3)-(d3) for comparison (ROIs in (a3) are defined in Fig. 4). Panels (a1)-(a3) show the “ground truth” image with 1.0 mm x 1.0 mm resolution. All other panels correspond to reconstructions with 77 readouts (256 samples each). Panels (b1)-(b3) shows the Cartesian reconstruction with 1.5x3.0=4.5 mm2 resolution (FOV size = 384x230 mm2); arrows in (b2) and (b3) point to DRAs. Panels (c1)-(c3) show the non-apodized radial reconstruction with 1.5x1.5=2.25 mm2 resolution; arrow in (c2) points to negligible DRA, and those in (c3) show mild streaking. Panels (d1)-(d3) show the apodized radial reconstruction (same apodizer as Fig. 2(d) and Fig. 3(c)) with 1.92x1.92=3.7 mm2 resolution (no DRAs, negligible streaking); arrow in (d3) points to over-smoothening of a small feature, which is a consequence of the lower resolution compared to the ground truth in (a3).
Figure 6
Figure 6
Representative first-pass myocardial perfusion images (mid-ventricular slice) from each of the 12 healthy volunteer studies; all images correspond to a similarly selected early myocardial enhancement phase (defined as 8 R-R cycles after initial LV cavity enhancement). The first row in each panel, (a1)-(f1) in the top panel and (g1-l1) in the bottom panel, show Cartesian images (phase-encode direction from left to right). The second row in each panel, (a2)-(f2) in the top panel and (g2-l2) in the bottom panel, show the corresponding images for the optimized radial imaging scheme. For the radial images, the reconstructed frame (among 2-3 mid-ventricular frames in one R-R cycle) that best matched the mid-ventricular Cartesian image in terms of cardiac phase is shown. Arrows point to the observed dark-rim artifacts. No noticeable dark-rim artifact is seen in the radial images (although Panel (e2) shows mild streaking in the septum). Examples of qualitative artifact scores are as follows: for (a1)-(a2), Cartesian = 3.5, Radial = 0; and for (i1)-(i2): Cartesian = 3; Radial = 1. The signal-to-noise ratio (SNR) in the myocardium (mean intensity divided by standard deviation in a homogeneous region at peak enhancement) is similar between Cartesian and radial images (Cartesian: 10.4±2.5 vs. radial: 11.7±2.2, P=0.40).
Figure 7
Figure 7
(a): Summary of artifact scores for the representative first-pass perfusion images (Fig. 6) assigned by two expert readers (consensus 0-4 scale scoring; 0: no artifact, 1: negligible, 2: mild, 3: moderate, 4: severe artifact); the results clearly show the superiority of optimized radial imaging in reducing the DRA (Cartesian: 2.83±0.8 vs. optimized radial: 0.24±0.32, P<0.0001). (b): Quantification scheme for measuring the maximum width (largest transmural extent) of the dark-rim artifact along angular directions (as explained in Methods). (c) Summary of the DRA width measurements as shown in (b), indicating that the maximal width of DRA is significantly reduced with optimized radial imaging (Cartesian: 3.28±0.46 vs. optimized radial: 0.58±0.47, P<0.0001). Note that quantitative DRA measurements become less accurate for sub-pixel widths.

References

    1. Nesto RW, Kowalchuk GJ. The ischemic cascade: temporal sequence of hemodynamic, electrocardiographic and symptomatic expressions of ischemia. The American Journal of Cardiology. 1987;59:23C–30C. - PubMed
    1. Atkinson DJ, Burstein D, Edelman RR. First-pass cardiac perfusion: evaluation with ultrafast MR imaging. Radiology. 1990;174:757–762. - PubMed
    1. Wilke NM, Jerosch-Herold M, Zenovich A, Stillman AE. Magnetic resonance first-pass myocardial perfusion imaging: clinical validation and future applications. J. Magn. Reson. Imaging. 1999;10:676–685. - PubMed
    1. Jerosch-Herold M, Kwong RY. Optimal imaging strategies to assess coronary blood flow and risk for patients with coronary artery disease. Current Opinion in Cardiology. 2008;23:599–606. - PMC - PubMed
    1. Arai AE. Magnetic resonance first-pass myocardial perfusion imaging. Top Magn Reson Imaging. 2000;11:383–398. - PubMed

Publication types