. 2013 Jul;86(1):197-207.
doi: 10.1016/j.anbehav.2013.05.012.

Harvester ants use interactions to regulate forager activation and availability

Affiliations

Harvester ants use interactions to regulate forager activation and availability

Noa Pinter-Wollman et al. Anim Behav. 2013 Jul.

Abstract

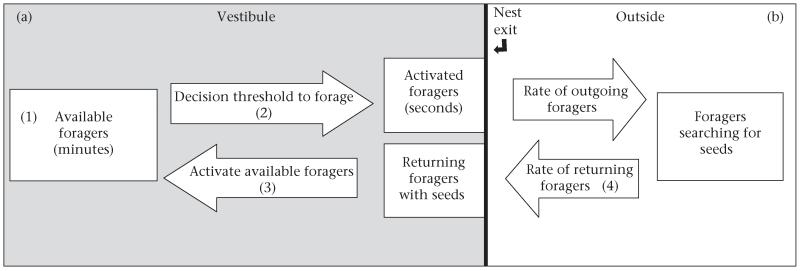
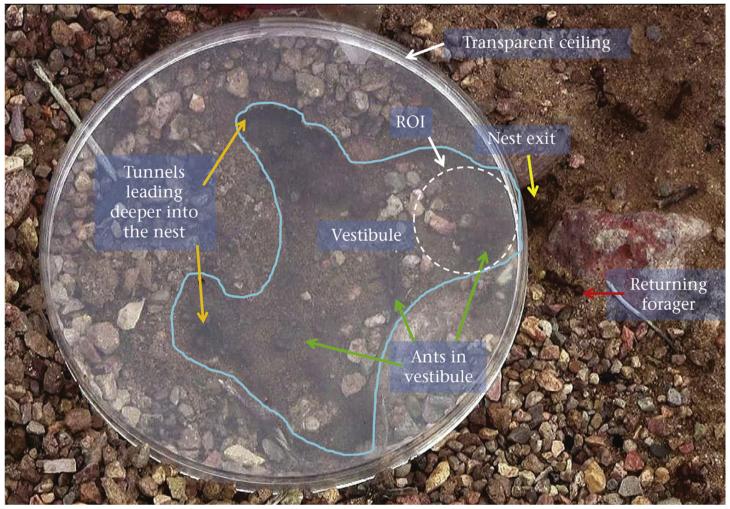
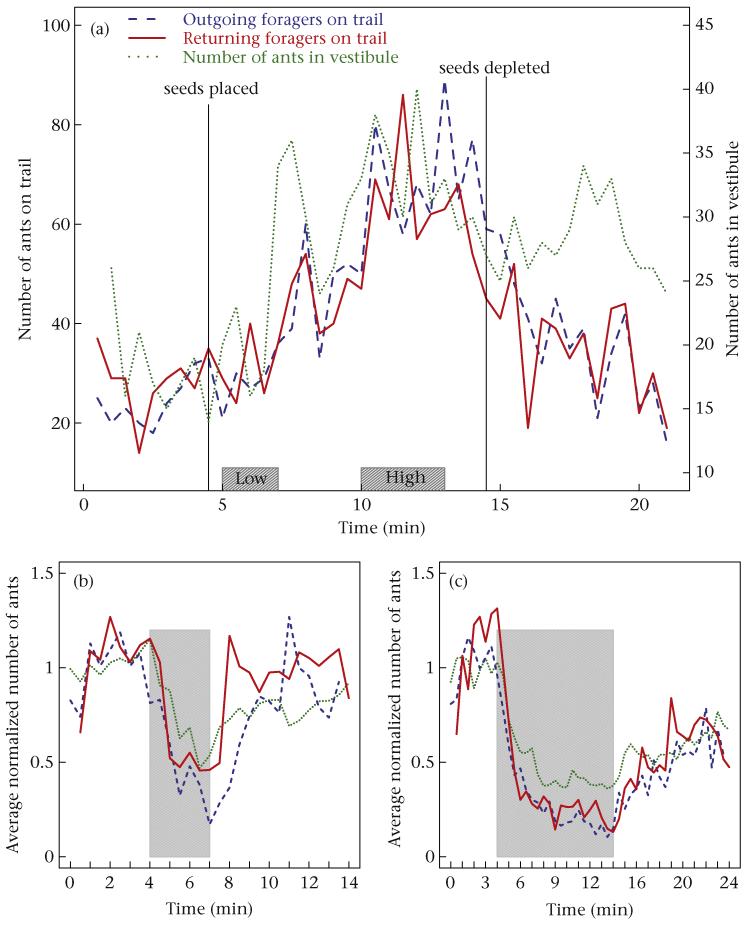
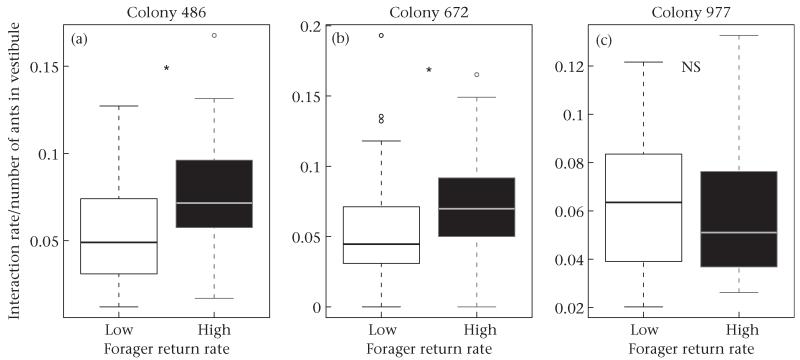
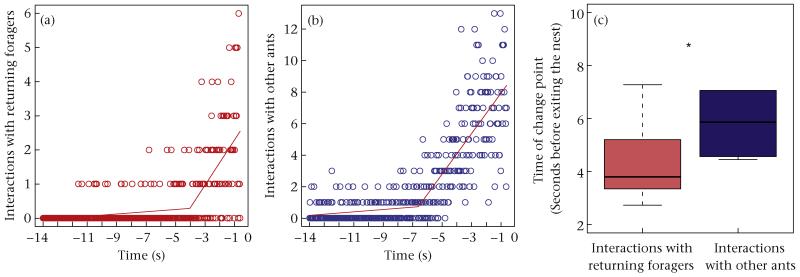
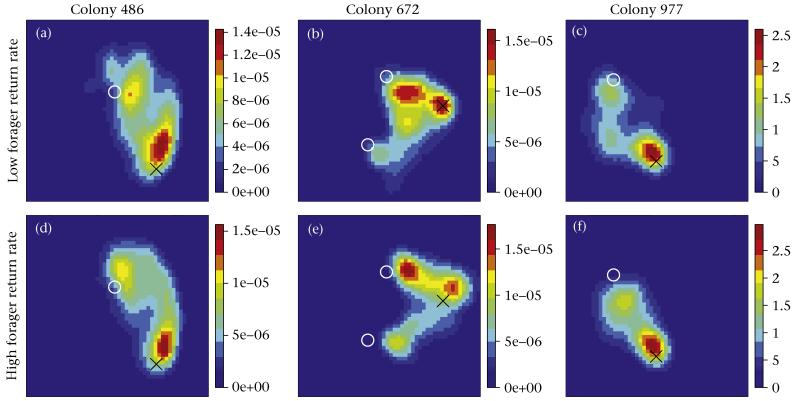
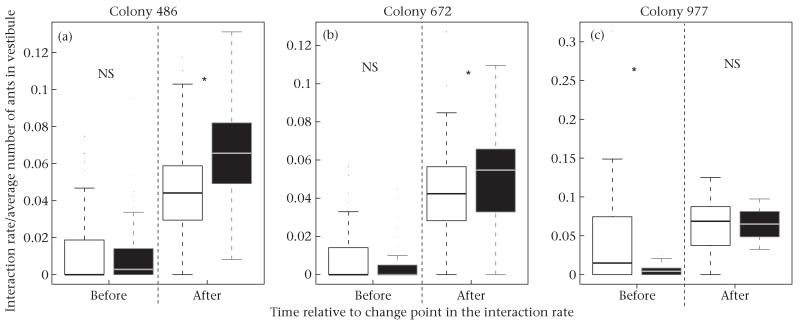
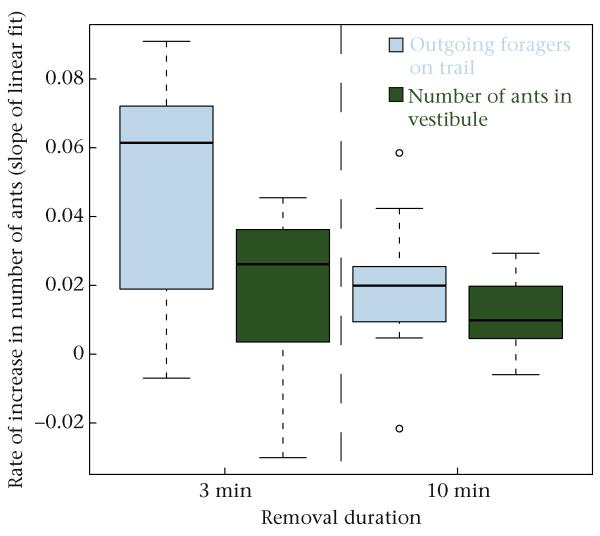
Social groups balance flexibility and robustness in their collective response to environmental changes using feedback between behavioural processes that operate at different timescales. Here we examine how behavioural processes operating at two timescales regulate the foraging activity of colonies of the harvester ant, Pogonomyrmex barbatus, allowing them to balance their response to food availability and predation. Previous work showed that the rate at which foragers return to the nest with food influences the rate at which foragers leave the nest. To investigate how interactions inside the nest link the rates of returning and outgoing foragers, we observed outgoing foragers inside the nest in field colonies using a novel observation method. We found that the interaction rate experienced by outgoing foragers inside the nest corresponded to forager return rate, and that the interactions of outgoing foragers were spatially clustered. Activation of a forager occurred on the timescale of seconds: a forager left the nest 3-8 s after a substantial increase in interactions with returning foragers. The availability of outgoing foragers to become activated was adjusted on the timescale of minutes: when forager return was interrupted for more than 4-5 min, available foragers waiting near the nest entrance went deeper into the nest. Thus, forager activation and forager availability both increased with the rate at which foragers returned to the nest. This process was checked by negative feedback between forager activation and forager availability. Regulation of foraging activation on the timescale of seconds provides flexibility in response to fluctuations in food abundance, whereas regulation of forager availability on the timescale of minutes provides robustness in response to sustained disturbance such as predation.

Keywords: Pogonomyrmex barbatus; collective behaviour; complex system; flexibility; foraging; interaction rate; regulation; robustness; temporal dynamics; timescale.


Figures

Figure 1
Figure 1
Diagram of the regulation of foraging behaviour in harvester ants. (a) Processes identified in the current study as occurring inside the nest vestibule. (b) Processes known from previous work to occur outside the nest. (1) Forager availability (numbers of ants) in the vestibule changes on the timescale of minutes. (2) An available forager’s decision whether to leave the nest depends on its interactions with returning foragers on the timescale of seconds. (3) Interactions of returning foragers with available foragers activate the available foragers. In addition, a returning forager can become an available forager once it drops off the food item it brought into the nest. (4) The rate at which foragers return to the nest depends on food availability.
Figure 2
Figure 2
Spatial arrangement of the nest vestibule. The image was taken from a frame of the video for experiment 1, colony 672. The round object is the transparent ceiling; the blue line is the boundary of the vestibule; orange arrows indicate the tunnels leading from the vestibule deeper into the nest; the yellow arrow indicates the nest exit through which foragers entered and left the foraging trail; green arrows point to ants that are standing in the vestibule; the red arrow indicates a returning forager carrying a seed; the dashed white circle near the nest exit is the region of interest (ROI) used in the spatial analysis.
Figure 3
Figure 3
(a) Number of returning and outgoing foragers on the trail and number of ants inside the vestibule for colony 486 in experiment 1; boxes indicate the low and high forager return rate periods; solid vertical lines indicate the times at which seeds were placed on the trail and depleted by the ants. (b, c) Average normalized number of returning and outgoing foragers on the trail and number of ants inside the vestibule for 3 min removals (N = 10) and 10 min removals (N = 12), respectively, in experiment 2; grey shading indicates the time during which returning foragers were prevented from returning to the nest.
Figure 4
Figure 4
Difference in interaction rate divided by the number of ants in the vestibule between low (white bars) and high (black bars) forager return rate periods for the three colonies in experiment 1. Boxes indicate the lower and upper quartiles; horizontal lines within boxes indicate the median, whiskers extend to the 1.5 interquartile range from the box, and points indicate outliers.
Figure 5
Figure 5
Total number of interactions with (a) returning foragers and (b) other ants at each video frame (1/30 s) before an ant left the nest, in colony 486 for the period of high forager return rate. Lines are the piecewise linear regressions. Time zero indicates when an ant left the nest and all preceding times are when it was in the vestibule. (c) Difference between the change point for interactions with returning foragers and with other ants; all colonies and foraging rate periods pooled. Boxes indicate the lower and upper quartiles; horizontal lines within boxes indicate the median, and whiskers extend to the 1.5 interquartile range from the box.
Figure 6
Figure 6
Spatial distribution of ant interactions during (a–c) low and (d–f) high forager return rate periods. Regions in red indicate many interactions and those in blue indicate few interactions (see scale bars). Black Xs denote the nest exit and white Os indicate tunnels that led further into the nest.
Figure 7
Figure 7
Difference between the low (white) and high (black) forager’ return rate periods in outgoing foragers’ interaction rate before and after the change point. Boxes indicate the lower and upper quartiles; horizontal lines within boxes indicate the median, whiskers extend to the 1.5 interquartile range from the box, and points indicate outliers.
Figure 8
Figure 8
Differences in rate of increase of the number of ants in the vestibule and outgoing foragers when foragers were allowed to return to the nest after 3 min or 10 min removals. Boxes indicate the lower and upper quartiles; horizontal lines within boxes indicate the median, whiskers extend to the 1.5 interquartile range from the box, and points indicate outliers.

References

    1. Adler FR, Gordon DM. Information collection and spread by networks of patrolling ants. American Naturalist. 1992;140:373–400. - PubMed
    1. Alon U. An Introduction to Systems Biology: Design Principles of Biological Circuits. Chapman & Hall; London: 2006.
    1. Anderson C, Ratnieks FLW. Task partitioning in insect societies. I. Effect of colony size on queueing delay and colony ergonomic efficiency. American Naturalist. 1999;154:521–535. - PubMed
    1. Balbuena MS, Molinas J, Farina WM. Honeybee recruitment to scented food sources: correlations between in-hive social interactions and foraging decisions. Behavioral Ecology and Sociobiology. 2012;66:445–452.
    1. Beshers SN, Robinson GE, Mittenthal J. Response thresholds and division of labor in insect colonies. In: Detrain C, Deneubourg J-L, Pasteels JM, editors. Information Processing in Social Insects. Birkhauser Verlag; Basel: 1999. pp. 115–139.

LinkOut - more resources