. 2012 Jun 1;67(2):177-280.
doi: 10.3917/pope.1202.0177.

The Demography of Canada and the United States from the 1980s to the 2000s A Summary of Changes and a Statistical Assessment

Affiliations

The Demography of Canada and the United States from the 1980s to the 2000s A Summary of Changes and a Statistical Assessment

Magali Barbieri et al. Population (Engl Ed). .

Abstract

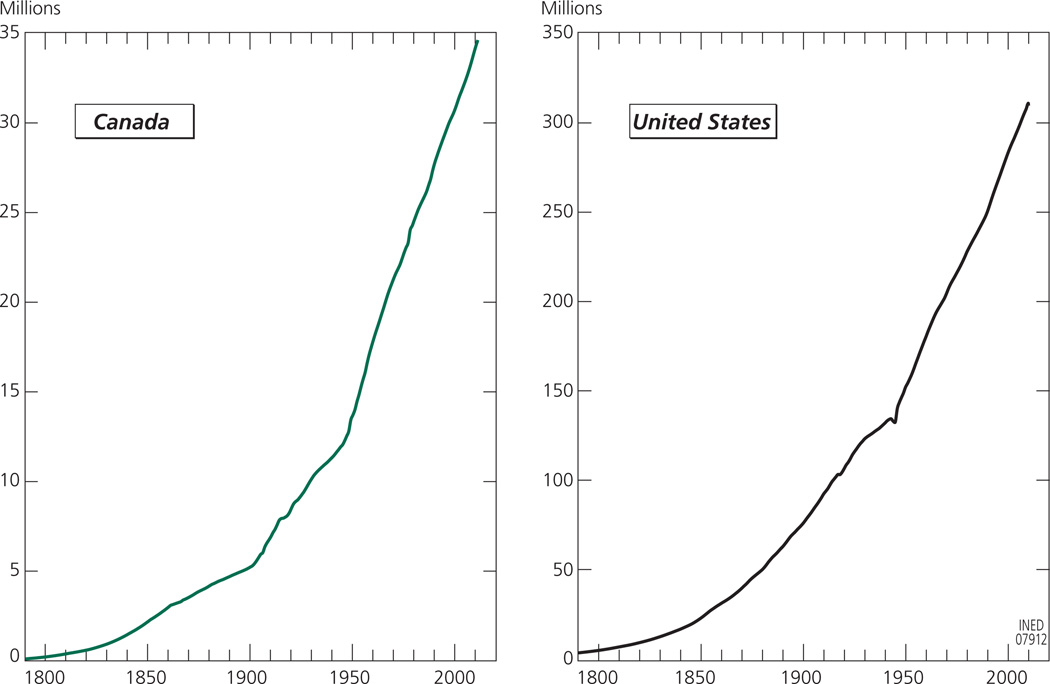
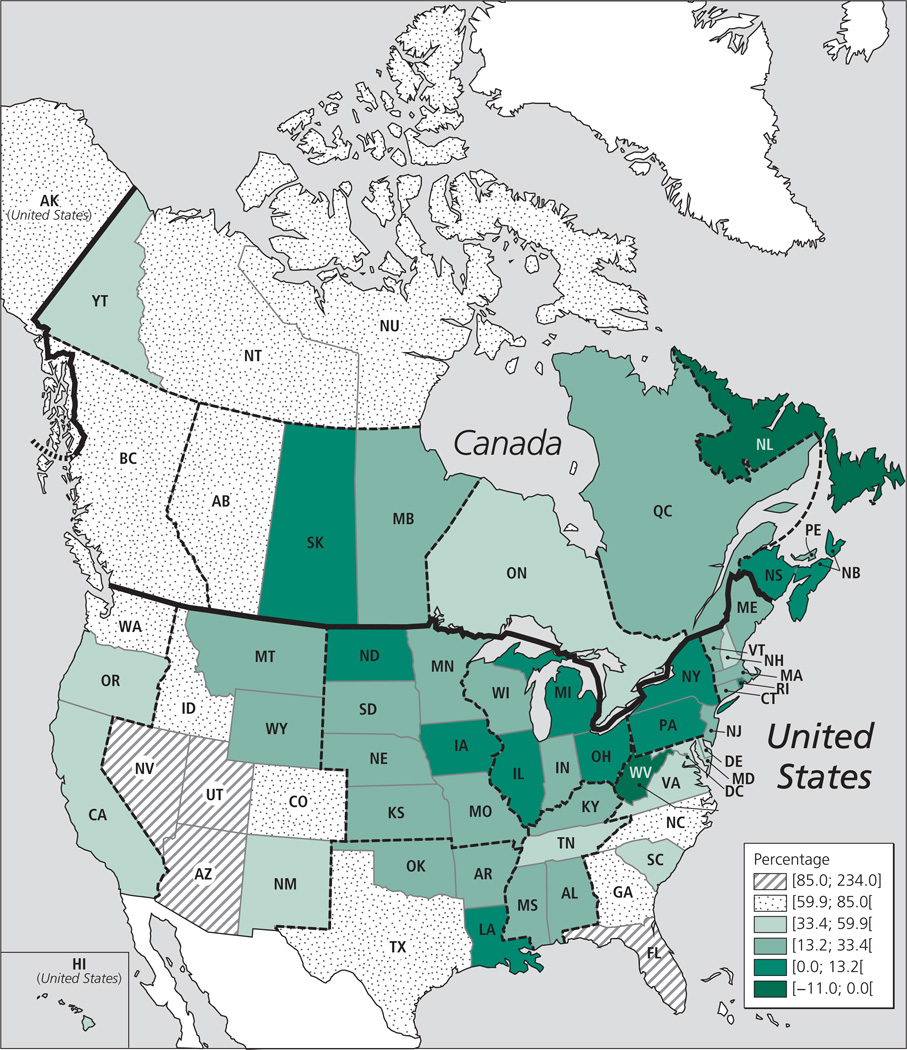
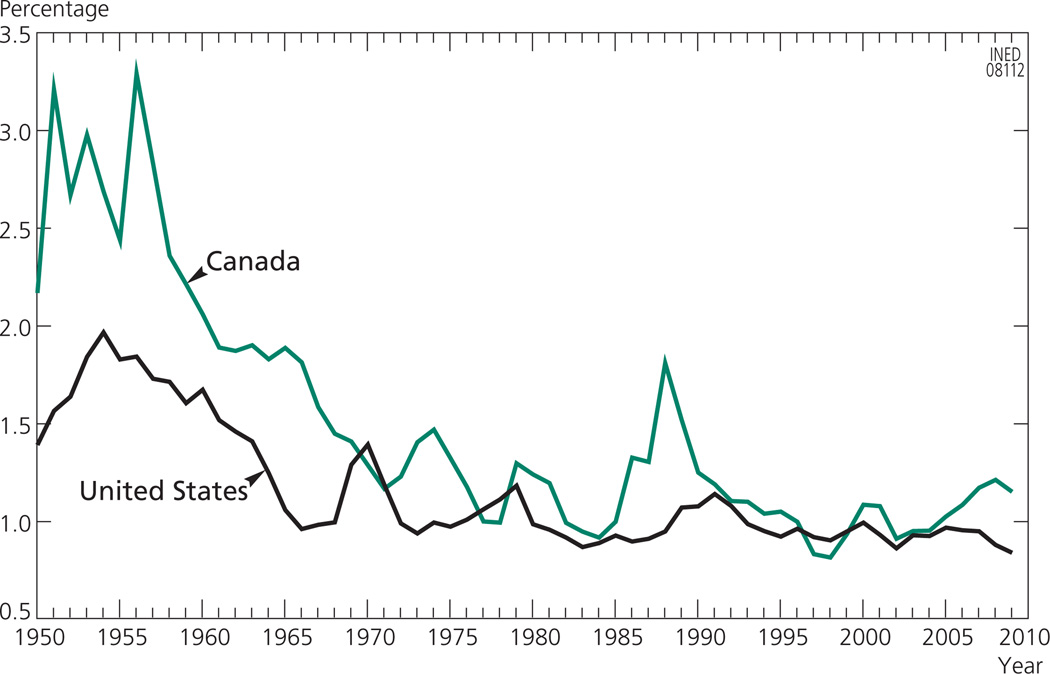
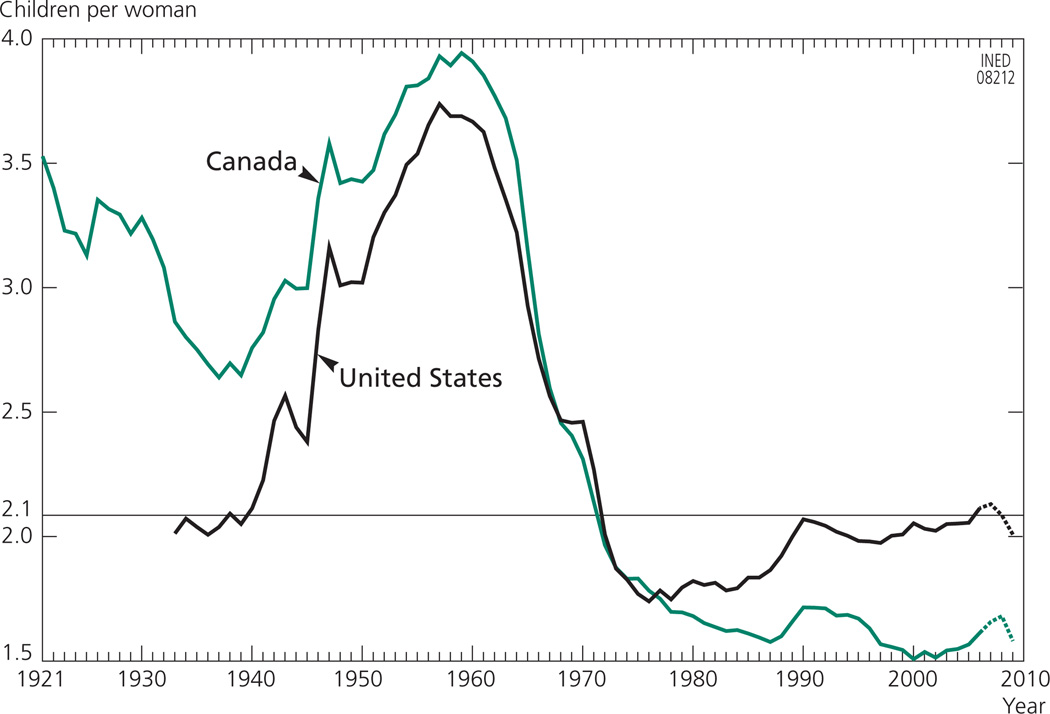
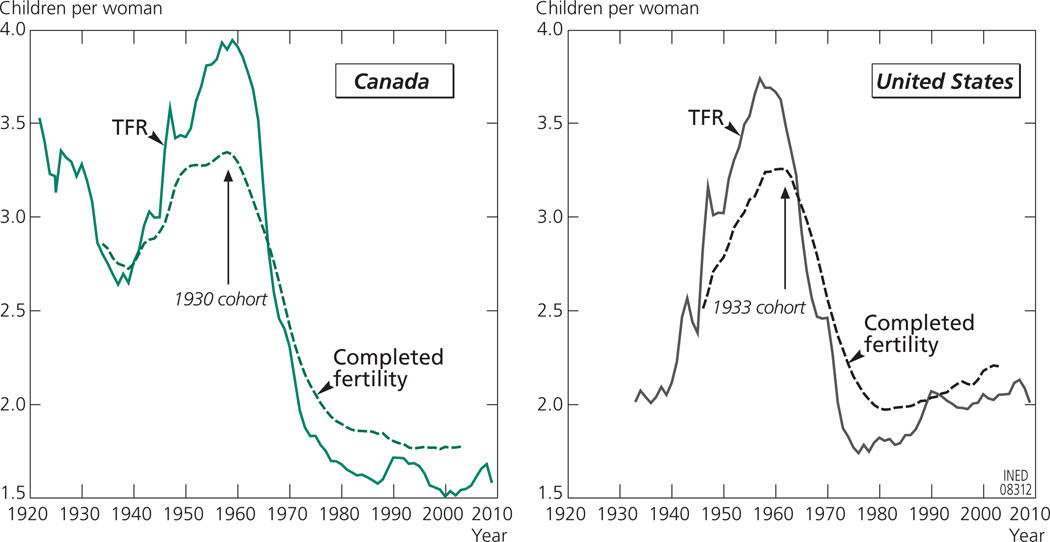
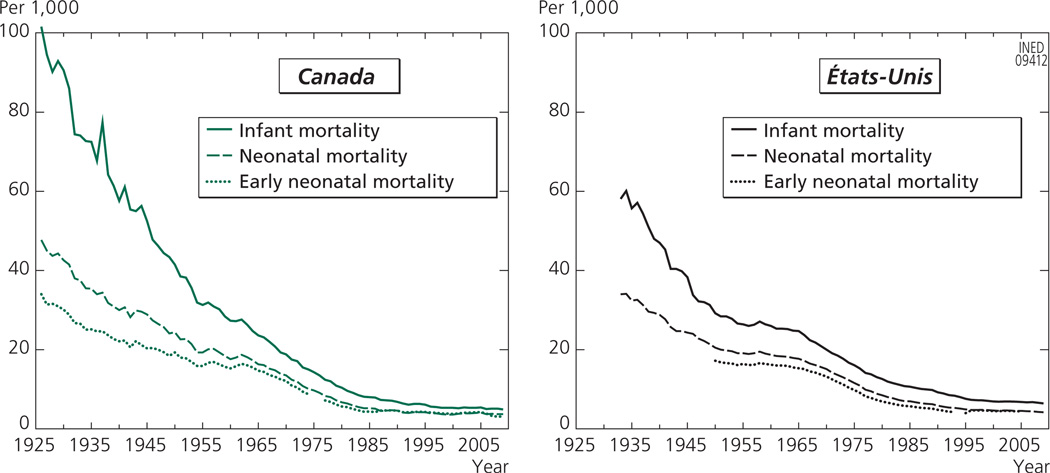
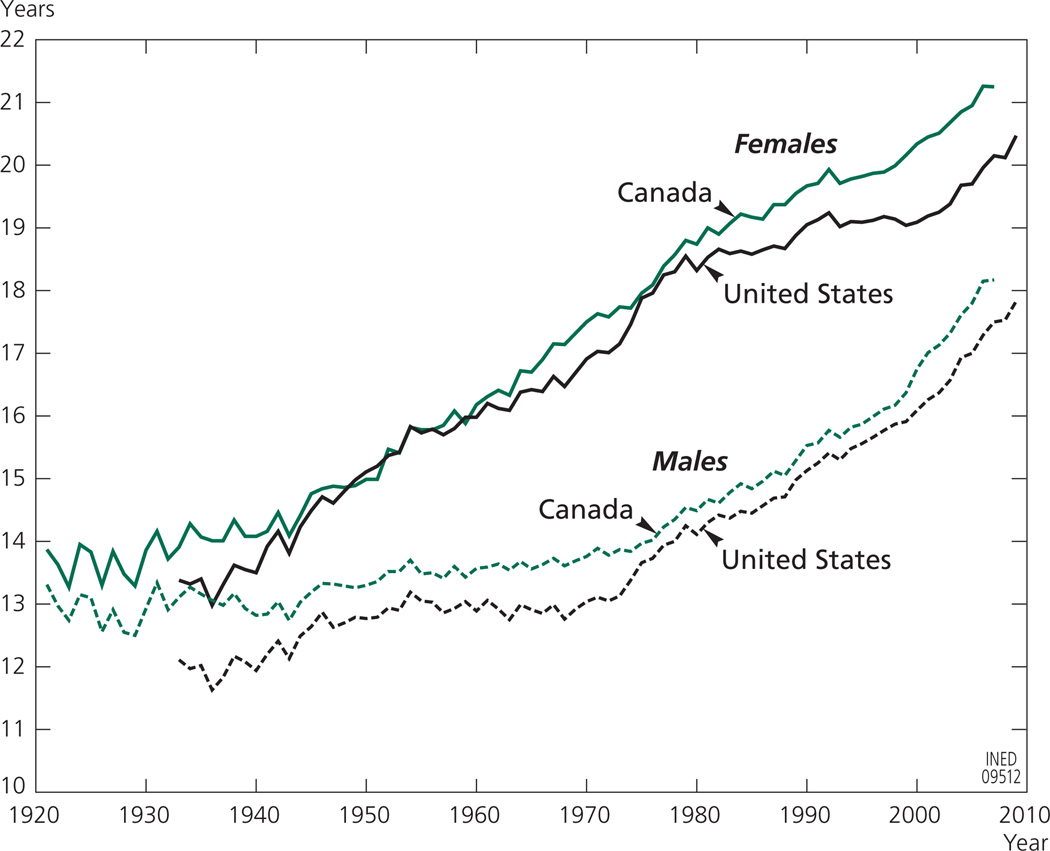
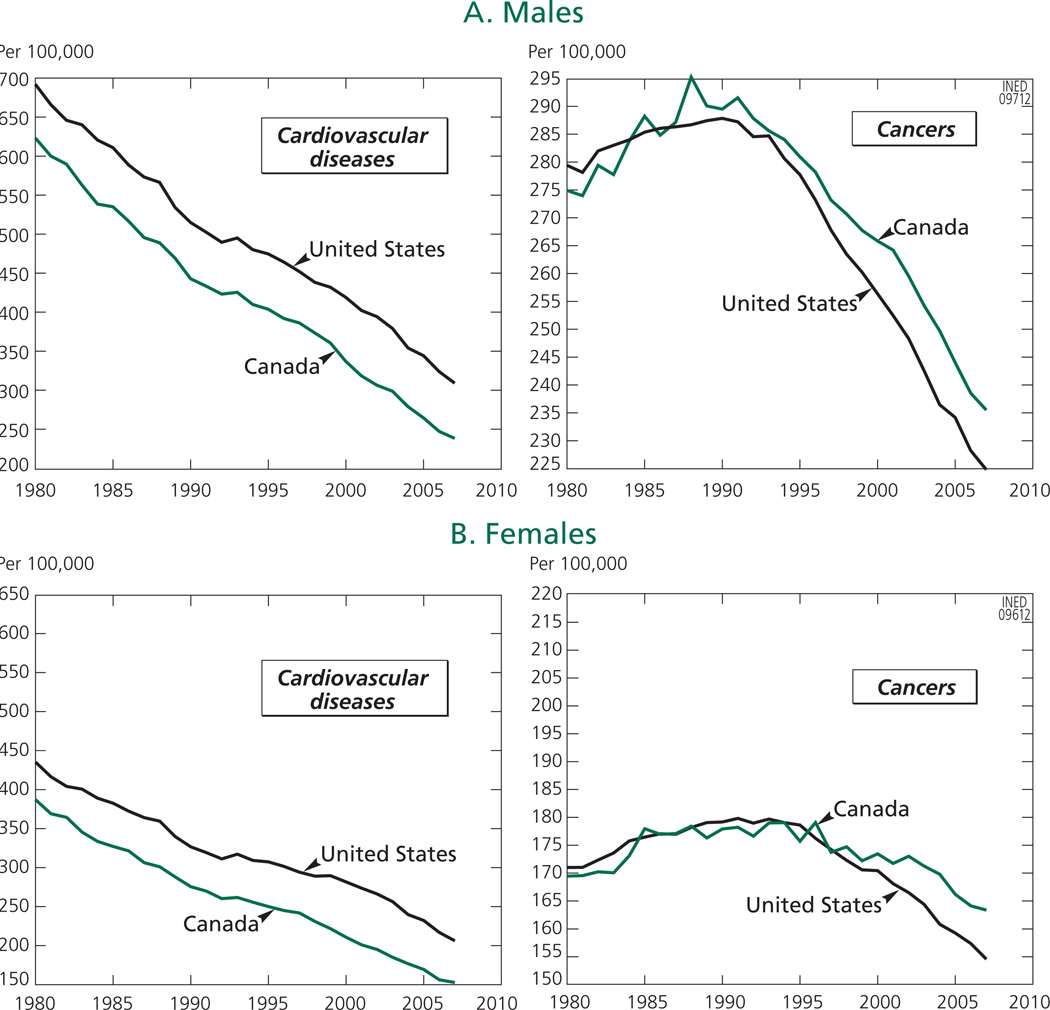
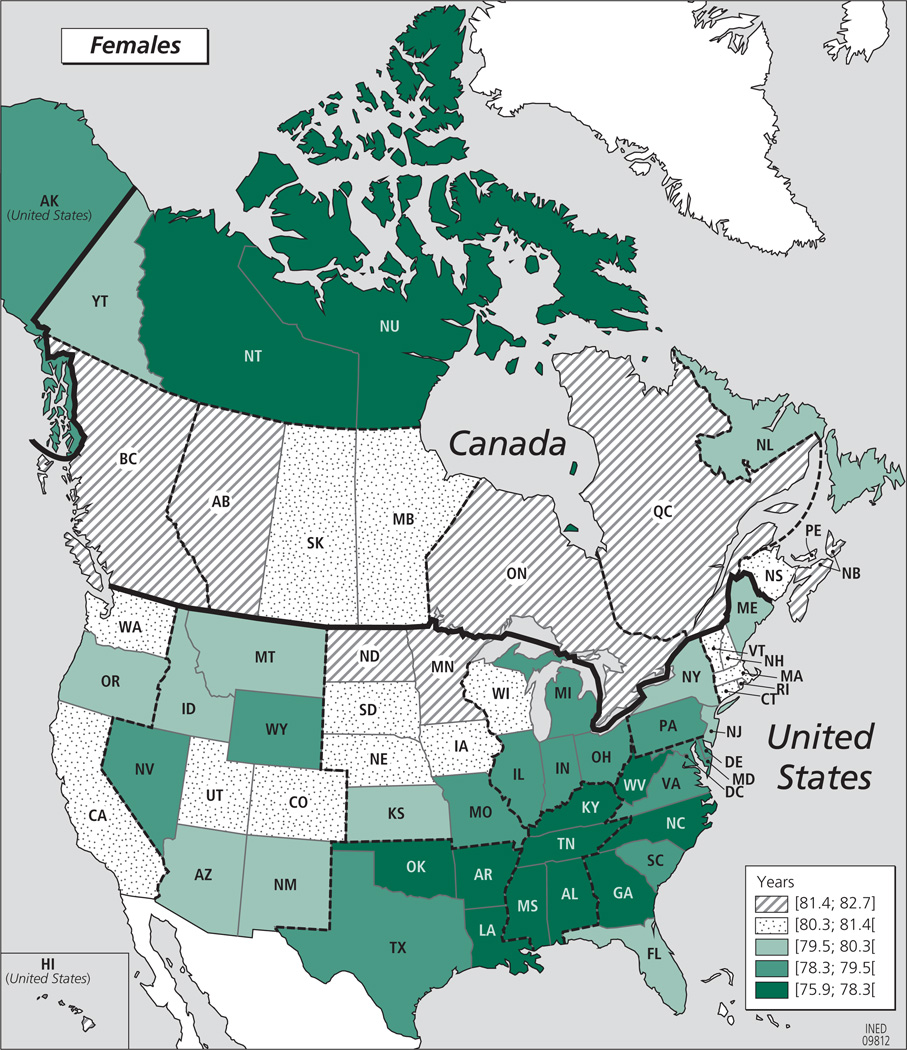
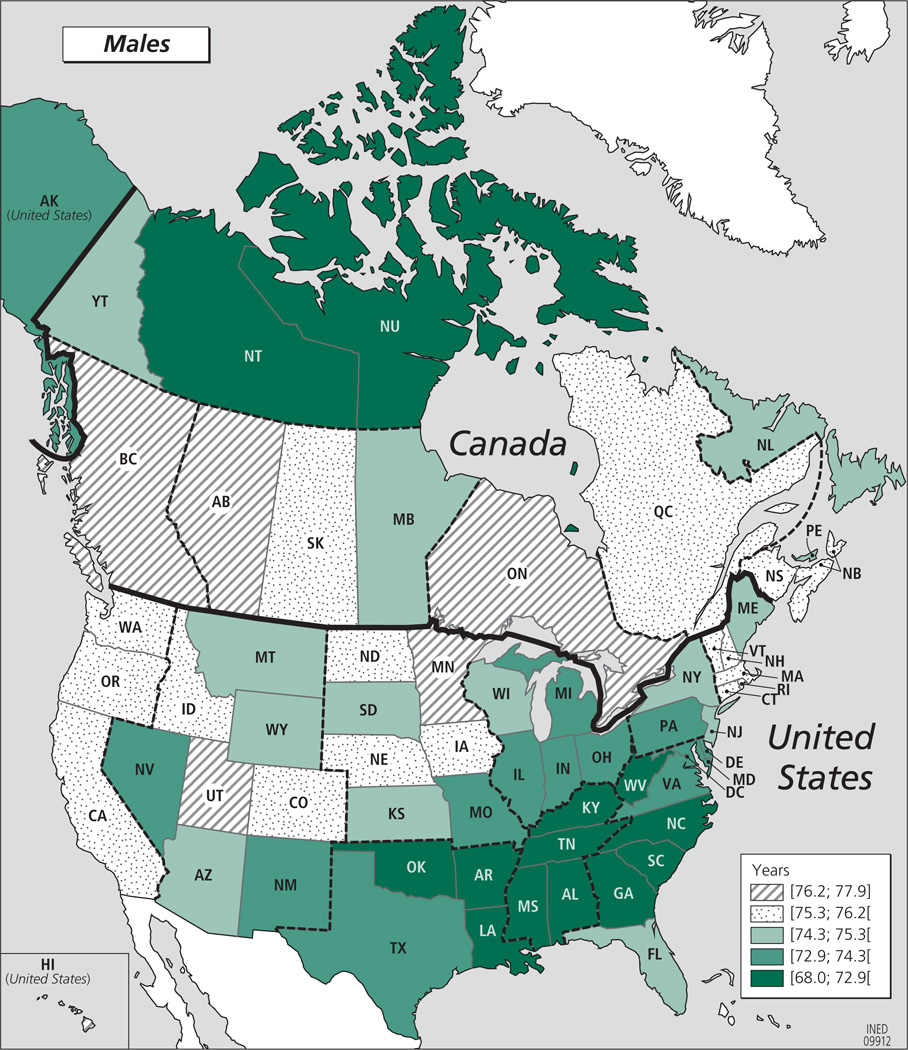
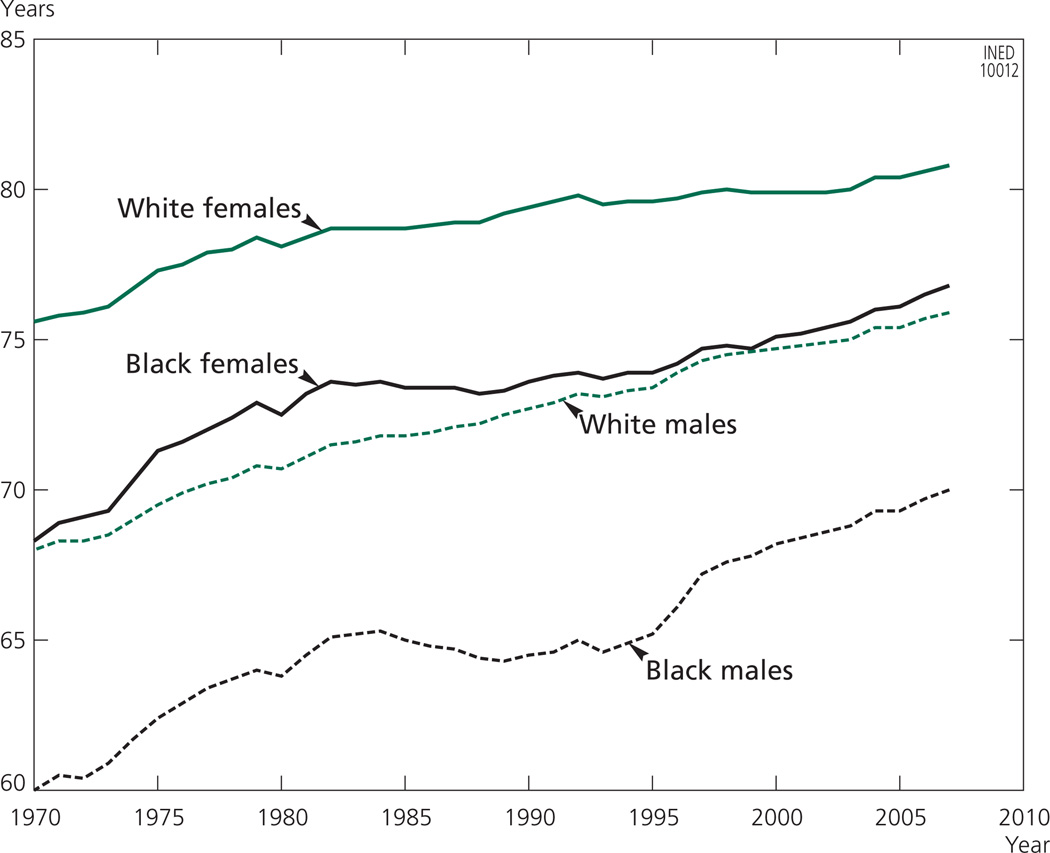
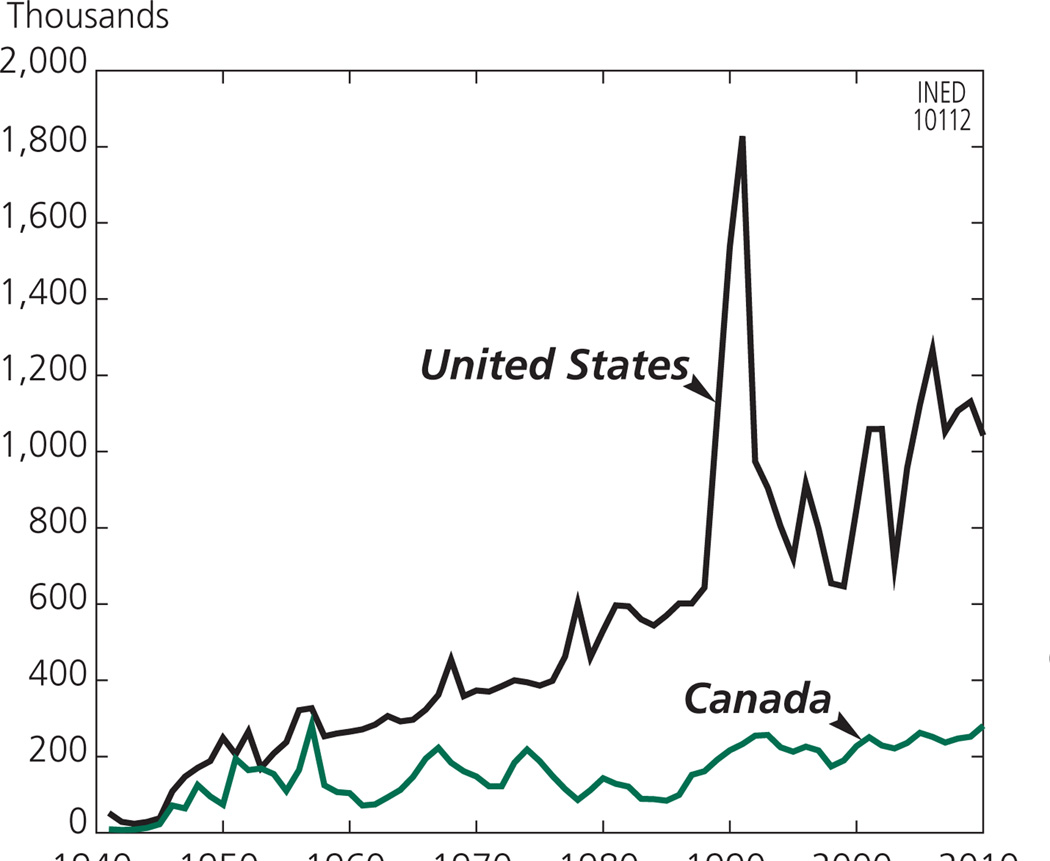
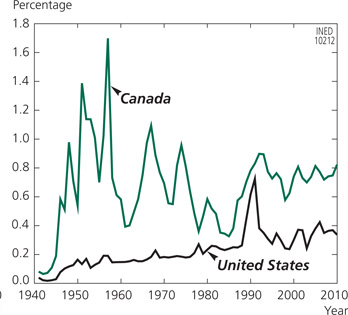
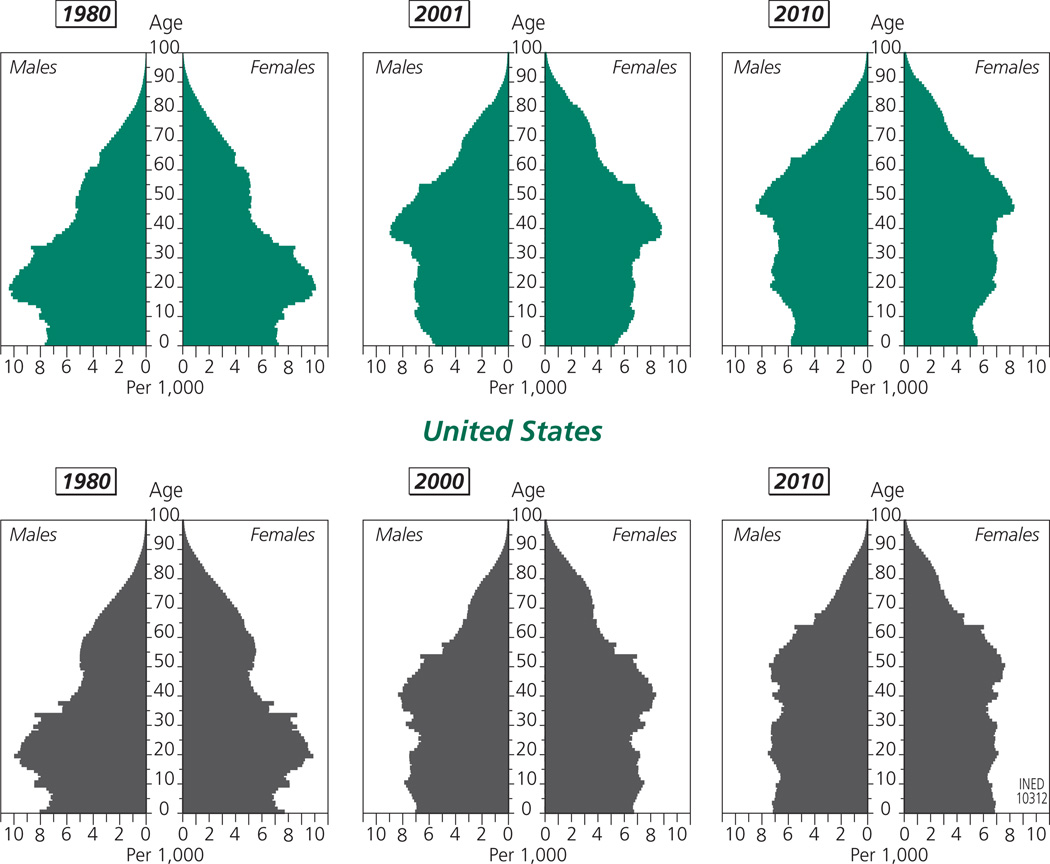
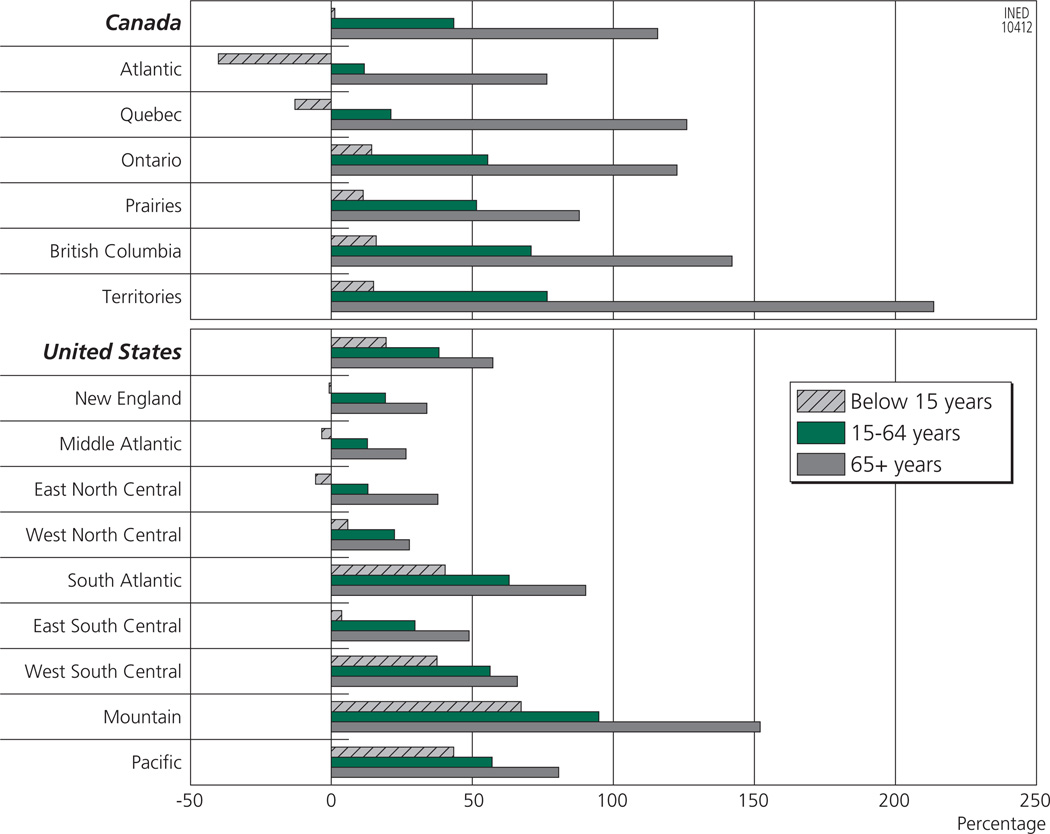
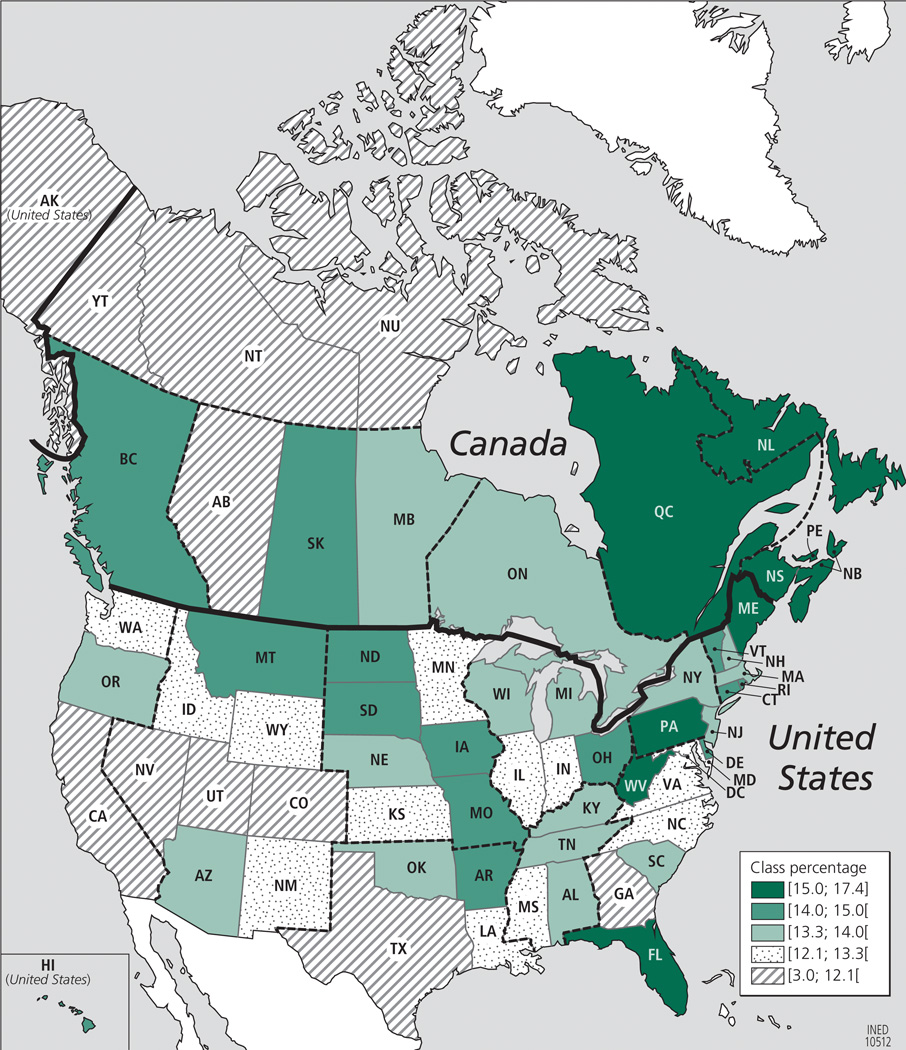
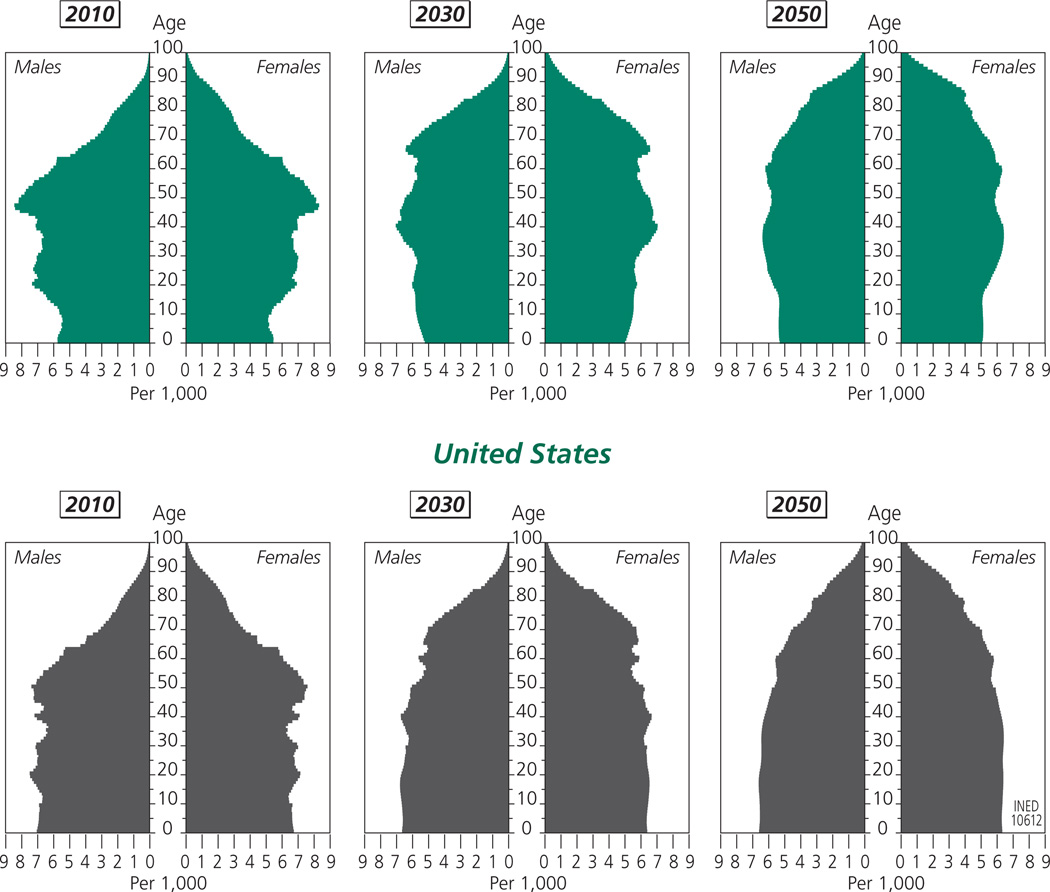
Canada and the United States have enjoyed vigorous population growth since the early 1980s. Although mortality is slightly higher in the United States than in Canada, this is largely offset by much higher fertility, with a total fertility rate at replacement level, compared with just 1.5 children per woman in Canada. The United States is also the world's largest immigrant receiving country, although its immigration rate is only half that of Canada, where today one person in five is foreign-born, versus one in eight in the United States. Based on recent trends in fertility, mortality and international migration, the populations of these two North American countries will continue to grow over the next five decades, but at a progressively slower pace. The most acute demographic issue today is not, as in Europe, that of imminent population decline, but rather of the geographic and social inequalities which have increased steadily since the early 1980s and which are reflected in major fertility and health differentials between regions and social groups.

Keywords: Canada; North America; United States; demographic ageing; demographic history; demographic projections; demographic situation; fertility; migration; mortality; nuptiality.


Figures

Figure 1
Figure 1
Maps of the Canadian regions, provinces and territories and the American regions and states
Figure 2
Figure 2
Population of Canada and the United States from 1790 to 2010 (millions) Sources: Canada: 1790–1866: Gemery (2000), Table 9.1; 1867–1977: Statistics Canada (1983), Table A1; 1978–2010: Statistics Canada, CANSIM database, Table 051–0001. United States: 1790–1970: United States Census Bureau (1975), Series A 6–8, Annual Population Estimates for the United States: 1790 to 1970 (in thousands); 1971–2010: United States Census Bureau, National Population Estimates, at http://www.census.gov/popest/data/historical/index.html, accessed on 2 March 2012.
Figure 3
Figure 3
Relative population growth (%) of Canadian provinces and territories and American states from 1980 to 2010* Note: On this map and the following ones, the class intervals were determined using the classification method developed by Fisher (1958) and applied in the R software environment. Inflection points are identified in order to group data in a way which minimizes differences between values within each class while maximizing the variation between classes. * Period from 1 July 1980 to 30 June 2010. Sources: Canada: Statistics Canada, CANSIM database, Table 051-0001. United States: 1980: United States Census Bureau, Table for “Resident Population of States” published in August 1995; 2010: United States Census Bureau, Table ST-EST00INT-ALLDATA published in September 2011.
Figure 4
Figure 4
Annual population growth rates in Canada and the United States, 1950–2009 Sources: United States: 1950–1979: authors’ calculations based on data from the United States Census Bureau (2011), Table HS-1. For the years 1980–2009 in the United States and for the entire period in Canada: same sources as in Appendix Table A.1.
Figure 5
Figure 5
Total fertility rate in Canada and the United States, 1921/1933–2009 Sources: Up to 2007: Human Fertility Database (2012); provisional data for 2008 and 2009: Statistics Canada (http://www.statcan.gc.ca/concepts/definitions/fertility-fecondite03-eng.htm) and Hamilton et al. (2010a and 2010b).
Figure 6
Figure 6
Total fertility rate and completed fertility (lagged by 28 years) in Canada and the United States, 1921/1933–2009 Note: Because data are incomplete from the 1958 cohort, we estimated completed fertility for the 1958 to 1975 cohorts by applying, for the ages not yet reached in each cohort, the age-specific fertility rates of women belonging to the most recent cohort for which these rates are known. For example, completed fertility for the 1975 cohort was calculated by aggregating the age-specific fertility rates observed at ages 12–32 years (the age reached by this cohort in 2007), to which we added the rate at age 33 for the 1974 cohort, at age 34 for the 1973 cohort, etc. It may seem rather perilous to proceed in this manner, but given that the bulk of fertility is concentrated before the age of 32 years (at which age the women of the 1967 cohort, who reached 40 in 2007, had already achieved 80% of their completed fertility), the margin of uncertainty is relatively small. Sources: Up to 2007: Human Fertility Database (2012); provisional data for 2008 and 2009: Statistics Canada (http://www.statcan.gc.ca/concepts/definitions/fertility-fecondite03-eng.htm) and Hamilton et al. (2010a and 2010b).
Figure 7
Figure 7
Age-specific fertility rates by cohort, Canada and the United States Source: Human Fertility Database (2012).
Figure 8
Figure 8
Ratios of cohort and period fertility rates (%), United States/Canada, 1933–2007 Source: Human Fertility Database (2012).
Figure 9
Figure 9
Parity progression ratios by cohort, Canada and the United States Source: Human Fertility Database (2012).
Figure 10
Figure 10
Total fertility rate in 2008 in the Canadian provinces and territories and the American states Sources: Canada: Statistics Canada, CANSIM database, Table 102–4505. United States: National Center for Health Statistics, at http://www.cdc.gov/nchs/vitalstats.htm, data downloaded 1 November 2011.
Figure 11
Figure 11
Total fertility rate by race and ethnic group, United States, 1980–2009 Note: The vertical line indicates a change in the classification of presented data, with a new distinction between Hispanic and non-Hispanic from 1989. Unlike the curves corresponding to White or non-Hispanic White women (who represented 90% of all White women in the 1990 census), there is no break in the fertility curves corresponding to Black and non-Hispanic Black women on this figure as the proportion of Hispanics reporting as Black is very low (4% in the 1990 census). Sources: Martin et al. (2011), Tables 4 and 8.
Figure 12
Figure 12
Crude marriage rate in Canada and the United States, 1960–2009 Note: The crude marriage rate corresponds to the annual number of marriages per 1,000 population. Source: Canada: 1960–1970: Statistics Canada (1983); 1971–2002: Statistics Canada (2005); 2003– 2004: Statistics Canada, CANSIM database, Table 101–1004. United States: 1960–1995: Haines (2006); 1996–2009: National Vital Statistics Report, Center for Disease Control.
Figure 13
Figure 13
Mean/median age at first marriage by sex, Canada and the United States, 1950–2011 Sources: For Canada: Human Resources and Skills Development Canada, at http://www4.hrsdc.gc.ca/.3ndic.1t.4r@-fra.jsp?iid=75, accessed on 14 January 2012. For the United States: 1950–1999: Fitch and Haines (2006); 2000–2011: United States Census Bureau, Current Population Survey, at www.census.gov/population/socdemo/hh-fam/ms2.xls, data downloaded on 12 January 2012.
Figure 14
Figure 14
Crude divorce rate in Canada and the United States, 1960–2009 Note: The crude divorce rate corresponds to the annual number of divorces per 1,000 population. Source: Canada: 1960–1970: Statistics Canada (1983); 1971–2002: Statistics Canada (2005); 2003– 2004: Statistics Canada, CANSIM database, Table 101–1004. United States: 1960–1995: Haines (2006); 1996–2009: National Vital Statistics Report, Center for Disease Control.
Figure 15
Figure 15
Life expectancy at birth by sex in Canada and the United States, 1920–2009 Source: Human Mortality Database (2012).
Figure 16
Figure 16
Gender gap in life expectancy at birth in Canada and the United States, 1920–2009 Source: Authors’ calculations based on data from the Human Mortality Database (2012).
Figure 17
Figure 17
Infant, neonatal and early neonatal mortality rates since the 1920s (per 1,000 live births), both sexes combined, in Canada and the United States Sources: Canada: for infant and neonatal mortality, 1926–1990: Wadhera and Strachan (1993a), Tables 2b and 6; 1991–2009: Statistics Canada, CANSIM database, Table 102–0507; for early neonatal mortality, authors’ calculations based on Statistics Canada, CANSIM database, Table 102–0508 and the Canadian Human Mortality Database (2012). United States: for infant and neonatal mortality, 1933–1974: National Center for Health Statistics (2002), Table 2–2: 1975–2009: Xu et al. (2010), Table 30; for early neonatal mortality, authors’ calculations based on MacDorman and Kirmeyer (2009), Table B, on National Center for Health Statistics (2002), Tables 3–2 and 4–1, and on the Human Mortality Database (2012).
Figure 18
Figure 18
Life expectancy at age 65 by sex in Canada and the United States, 1921–2009 Source: Human Mortality Database (2012).
Figure 19
Figure 19
Trends in the leading causes of death by sex in Canada and the United States, 1980–2007 Sources: Canada: authors’ calculations based on data from Statistics Canada. United States: authors’ calculations based on data from the National Center for Health Statistics.
Figure 20
Figure 20
A. Female life expectancy at birth in the Canadian provinces (2000) and territories (2000–2004) and the American states (1999–2001) B. Male life expectancy at birth in the Canadian provinces (2000) and territories (2000–2004) and the American states (1999–2001) Note: For consistency, we have presented life expectancies in the last year for which we have data for both countries, although the most recent data are for 2007 in Canada. Sources: Canada: Canadian Human Mortality Database (2012). United States: data prepared by Wilmoth et al. (2011).
Figure 20
Figure 20
A. Female life expectancy at birth in the Canadian provinces (2000) and territories (2000–2004) and the American states (1999–2001) B. Male life expectancy at birth in the Canadian provinces (2000) and territories (2000–2004) and the American states (1999–2001) Note: For consistency, we have presented life expectancies in the last year for which we have data for both countries, although the most recent data are for 2007 in Canada. Sources: Canada: Canadian Human Mortality Database (2012). United States: data prepared by Wilmoth et al. (2011).
Figure 21
Figure 21
Life expectancy at birth by race and sex in the United States, 1970–2007 Source: Arias (2011).
Figure 22
Figure 22
Immigrants (in thousands) to Canada and the United States, 1940–2010 Sources (for both figures): Canada: 1940–1979: Employment and Immigration Canada (1982); 1980–1985: Citizenship and Immigration Canada (2004); 1986–2010: Citizenship and Immigration Canada (2011). United States, 1941–1988: Carter et al. (2006); 1989–2000: United States Immigration and Naturalization Service (2002); 2001–2010: United States Department of Homeland Security (2011).
Figure 23
Figure 23
Canada and the United States, 1940–2010 Sources (for both figures): Canada: 1940–1979: Employment and Immigration Canada (1982); 1980–1985: Citizenship and Immigration Canada (2004); 1986–2010: Citizenship and Immigration Canada (2011). United States, 1941–1988: Carter et al. (2006); 1989–2000: United States Immigration and Naturalization Service (2002); 2001–2010: United States Department of Homeland Security (2011).
Figure 24
Figure 24
Population pyramids of Canada and the United States, 1980, 2001/2000 and 2010 Sources: Canada: Statistics Canada, CANSIM database, Table 051–0001. United States: 1980: United States Census Bureau, on website. www.census.gov/popest/data/national/asrh/1980s/80s_nat_detail.html; 2000: www.census.gov/popest/data/national/asrh/2009/files/NC-EST2009-ALLDATA-R-File02.csv; 2010: www.census.gov/popest/data/national/asrh/2009/files/NC-EST2009-ALLDATA-R-File22.csv.
Figure 25
Figure 25
Population growth rate by age group between 1980 and 2010 in Canada and the United States, by region Sources: Canada: Statistics Canada, CANSIM database, Table 051–0001. United States: 1980: United States Census Bureau, “Resident Population of States” table published in August 1995; 2010: United States Census Bureau, Table ST-EST00INT-ALLDATA published in September 2011.
Figure 26
Figure 26
Percentage of the population aged 65 and over in the Canadian provinces and territories and the American states in 2010 Sources: Canada: Statistics Canada, CANSIM database, Table 051–000. United States: United States Census Bureau, table ST-EST00INT-ALLDATA published in September 2011.
Figure 27
Figure 27
Population pyramids in Canada and the United States, 2010, 2030 and 2050 Sources: Canada: Statistics Canada (2010). United States: United States Census Bureau (2009a).

Similar articles

Cited by

References

    1. Adams O. Health Reports. 4. Vol. 2. Statistics Canada: 1990. “Life expectancy in Canada: an overview”; pp. 361–376. - PubMed
    1. Adveev A, Eremenko T, Festy P, Gaymu J, Le Bouteillec N, Springer S. “Populations and demographic trends of European countries, 1980–2010”. Population, English Edition. 2011;66(1):9–130. http://www.ined.fr/fichier/t_publication/1552/publi_pdf2_04_pope1101_avd...
    1. Ananth CV, Liu S, Joseph KS, Kramer MS. “A comparison of foetal and infant mortality in the United States and Canada”. International Journal of Epidemiology. 2009;38:480–489. - PubMed
    1. Anderton DL, Barrett RE, Bogue DJ. The Population of the United States. New York: The Free Press; 1997. p. 693.
    1. Arias E. National Vital Statistics Reports. 9. Vol. 59. National Center for Health Statistics; 2011. “United States life tables, 2007”; p. 60. http://www.cdc.gov/nchs/data/nvsr/nvsr59/nvsr59_09.pdf. - PubMed

LinkOut - more resources